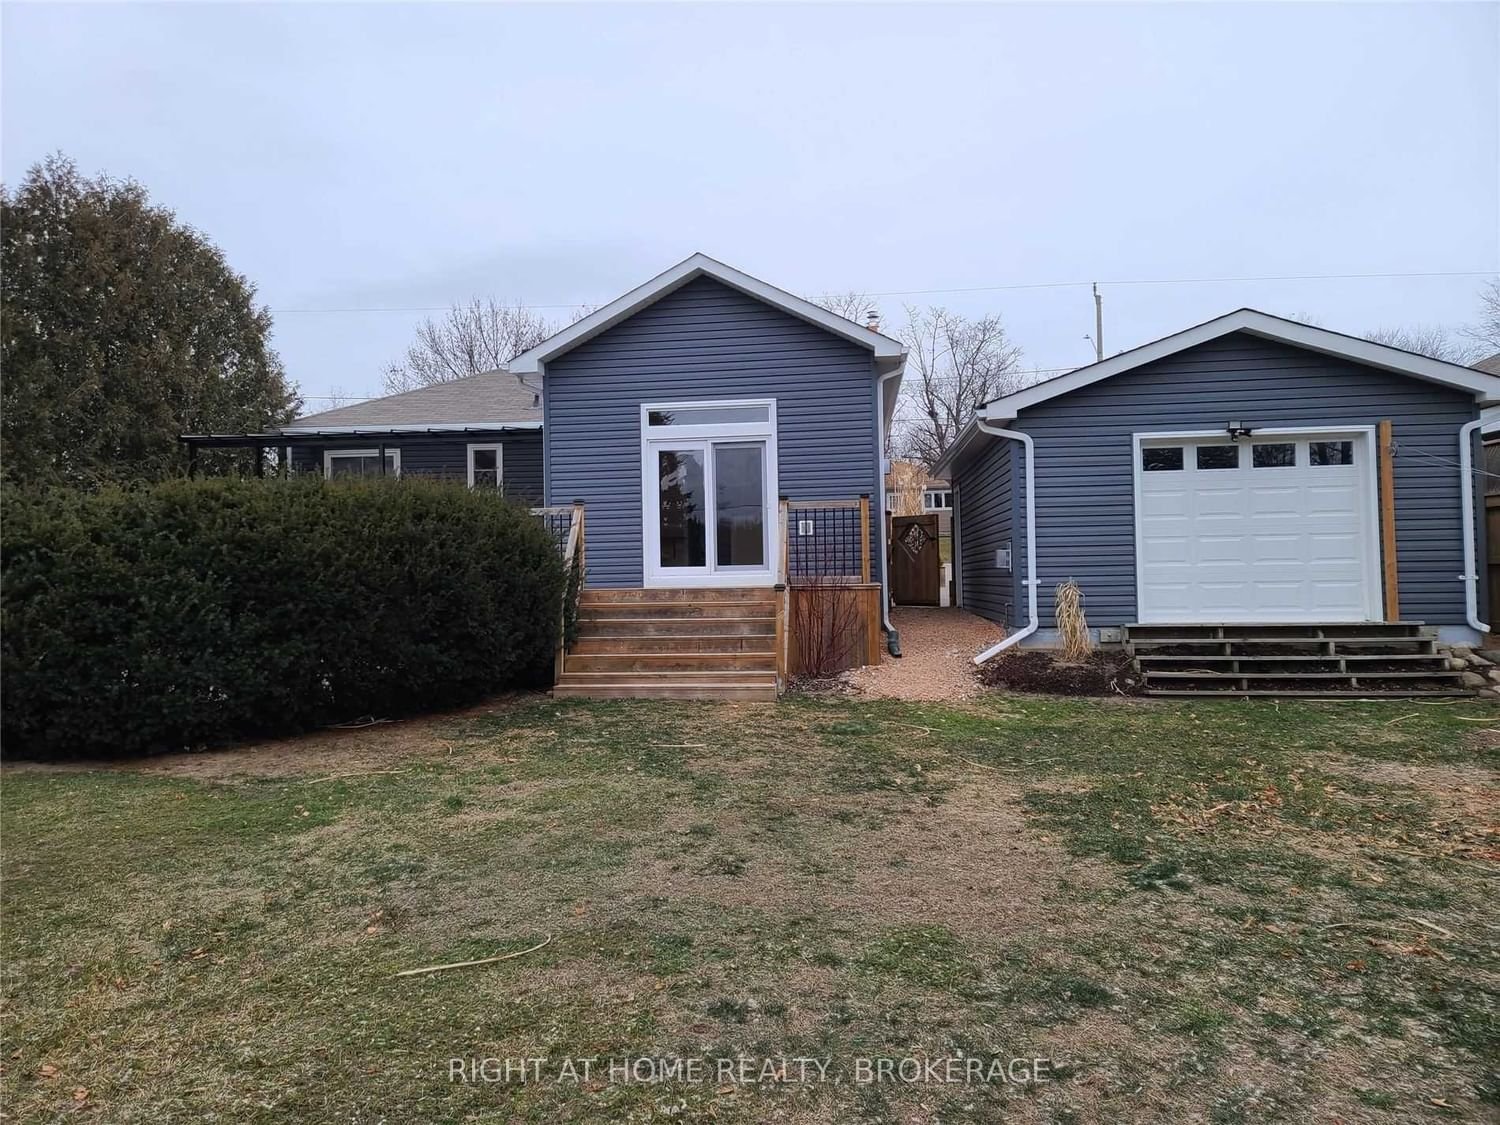
MLS Restricted Listing
Free account required. or to see all the details.
Free account required. or to see all the details.
1 / 18
Leased
$X,XXX/mth
-
-
-
-
Sold in 19 Days on Strata
Listing History
Property Highlights
Off Market Listing
Free account required. or to see all the details.
Free account required. or to see all the details.
Renter's Market
Balanced
Landlord's Market
Property Details
- Type
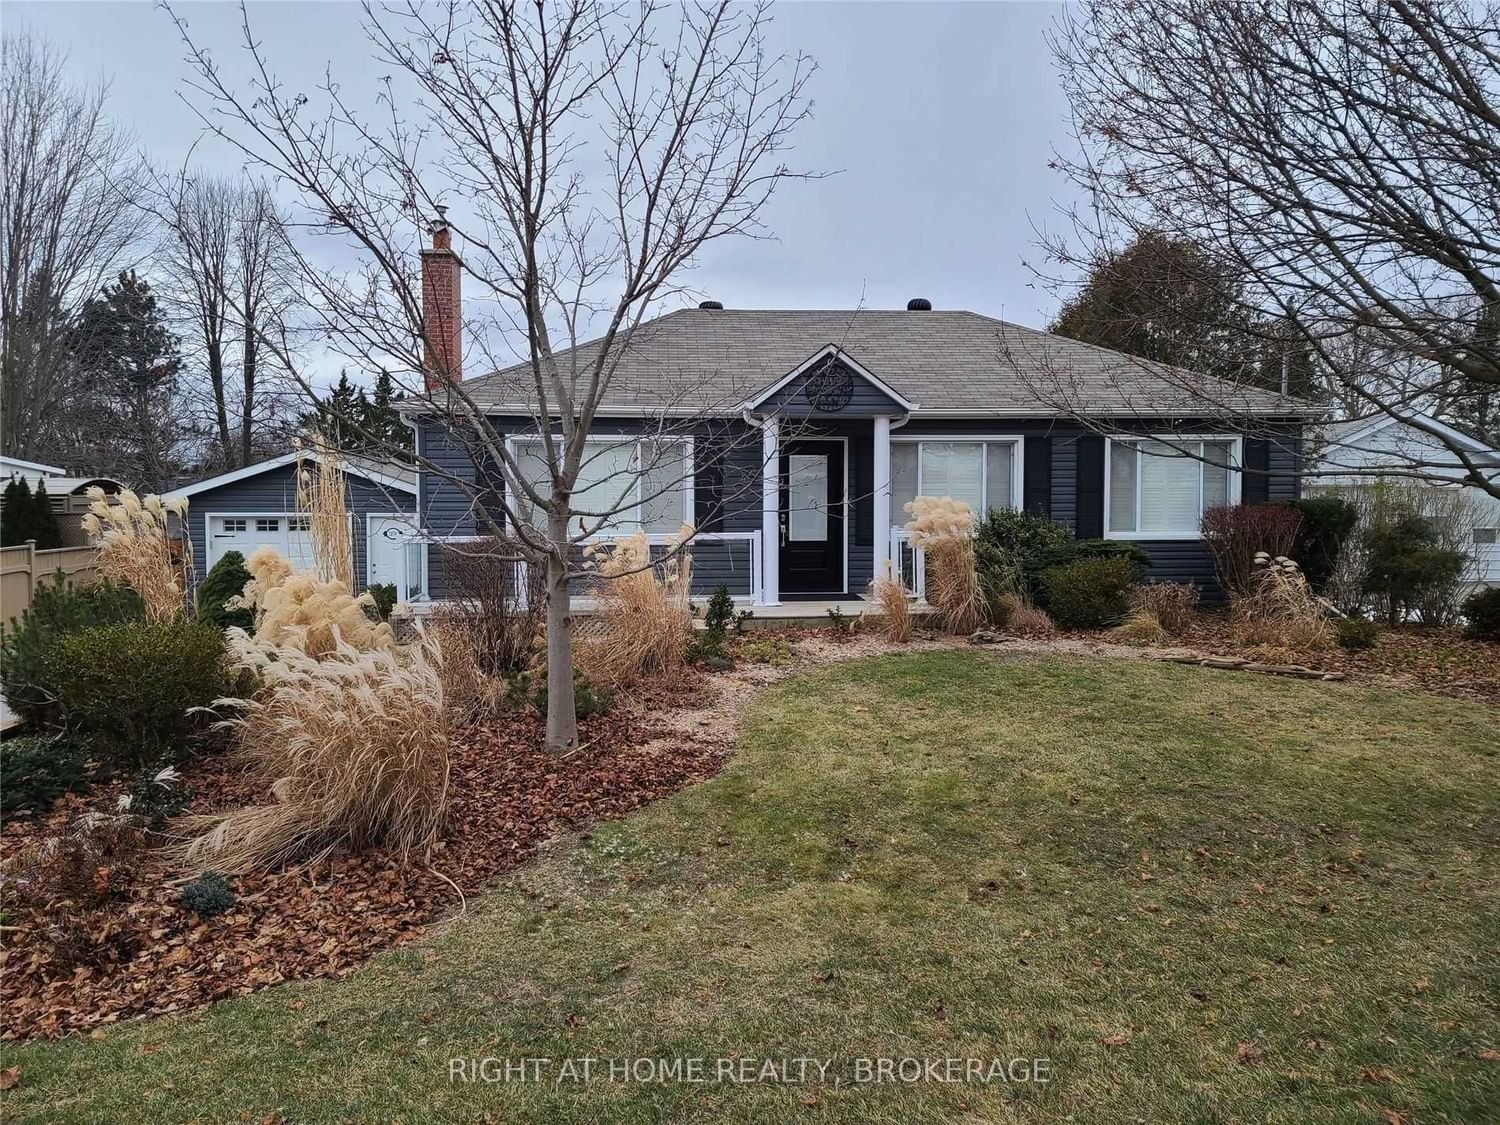
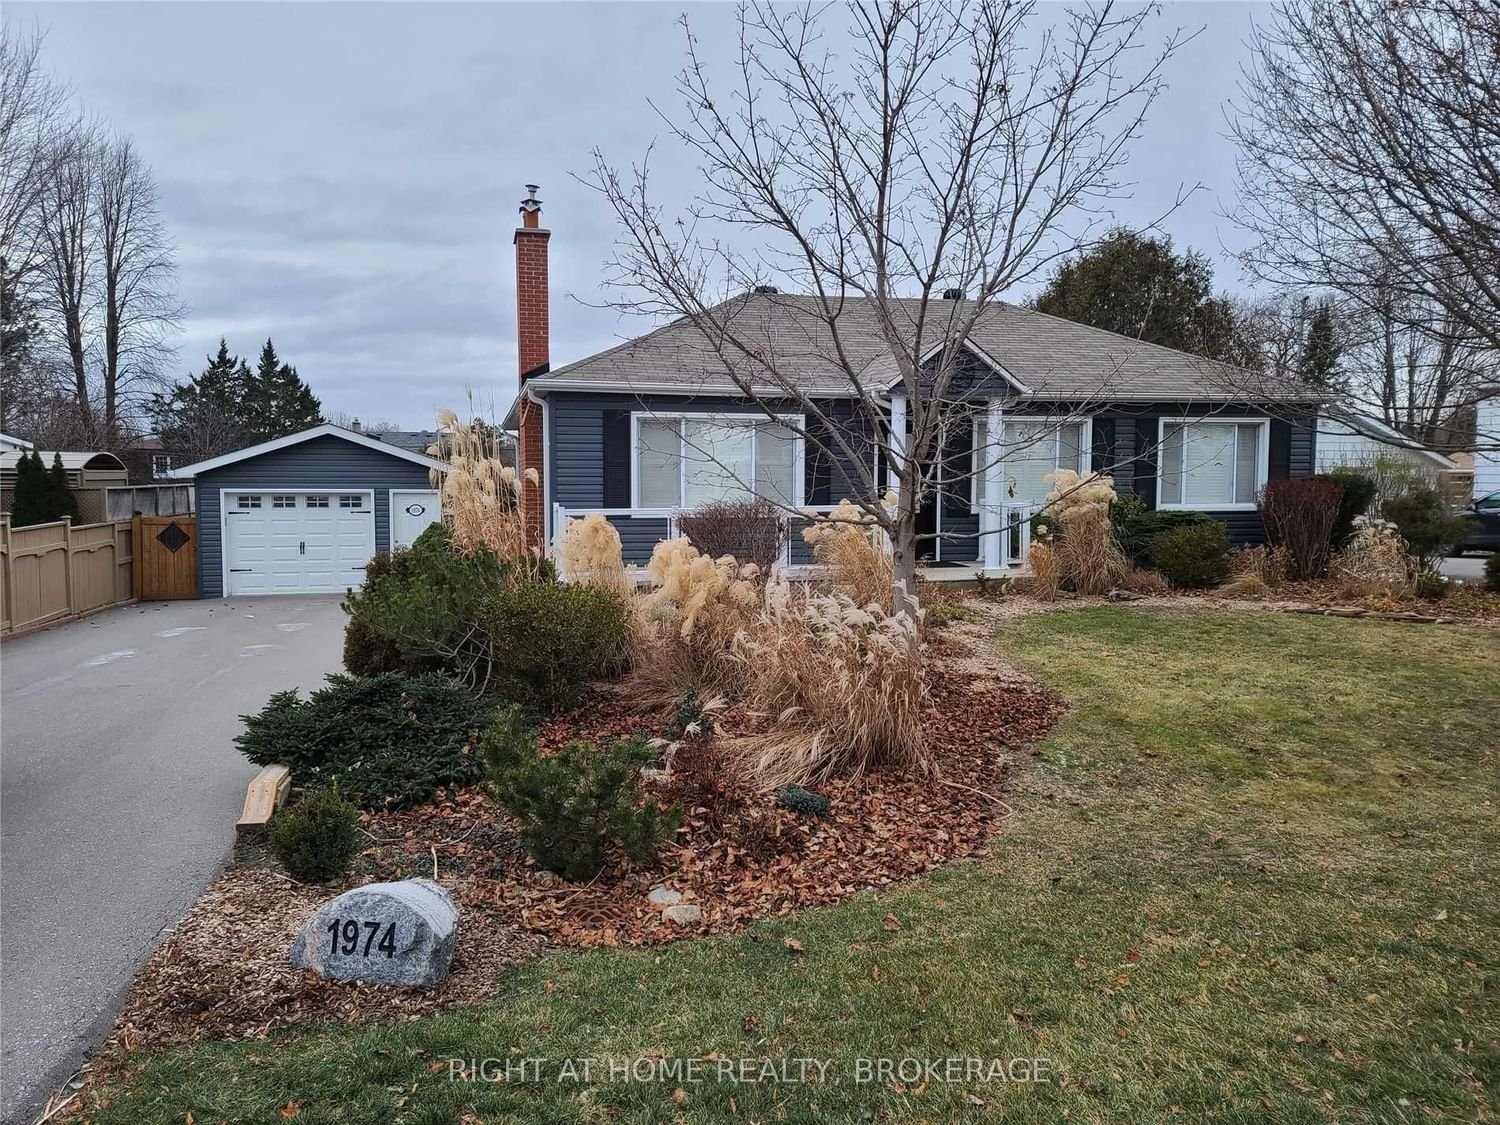
- Detached
- Exterior
- Vinyl Siding
- Style
- Bungalow
- Central Vacuum
- No Data
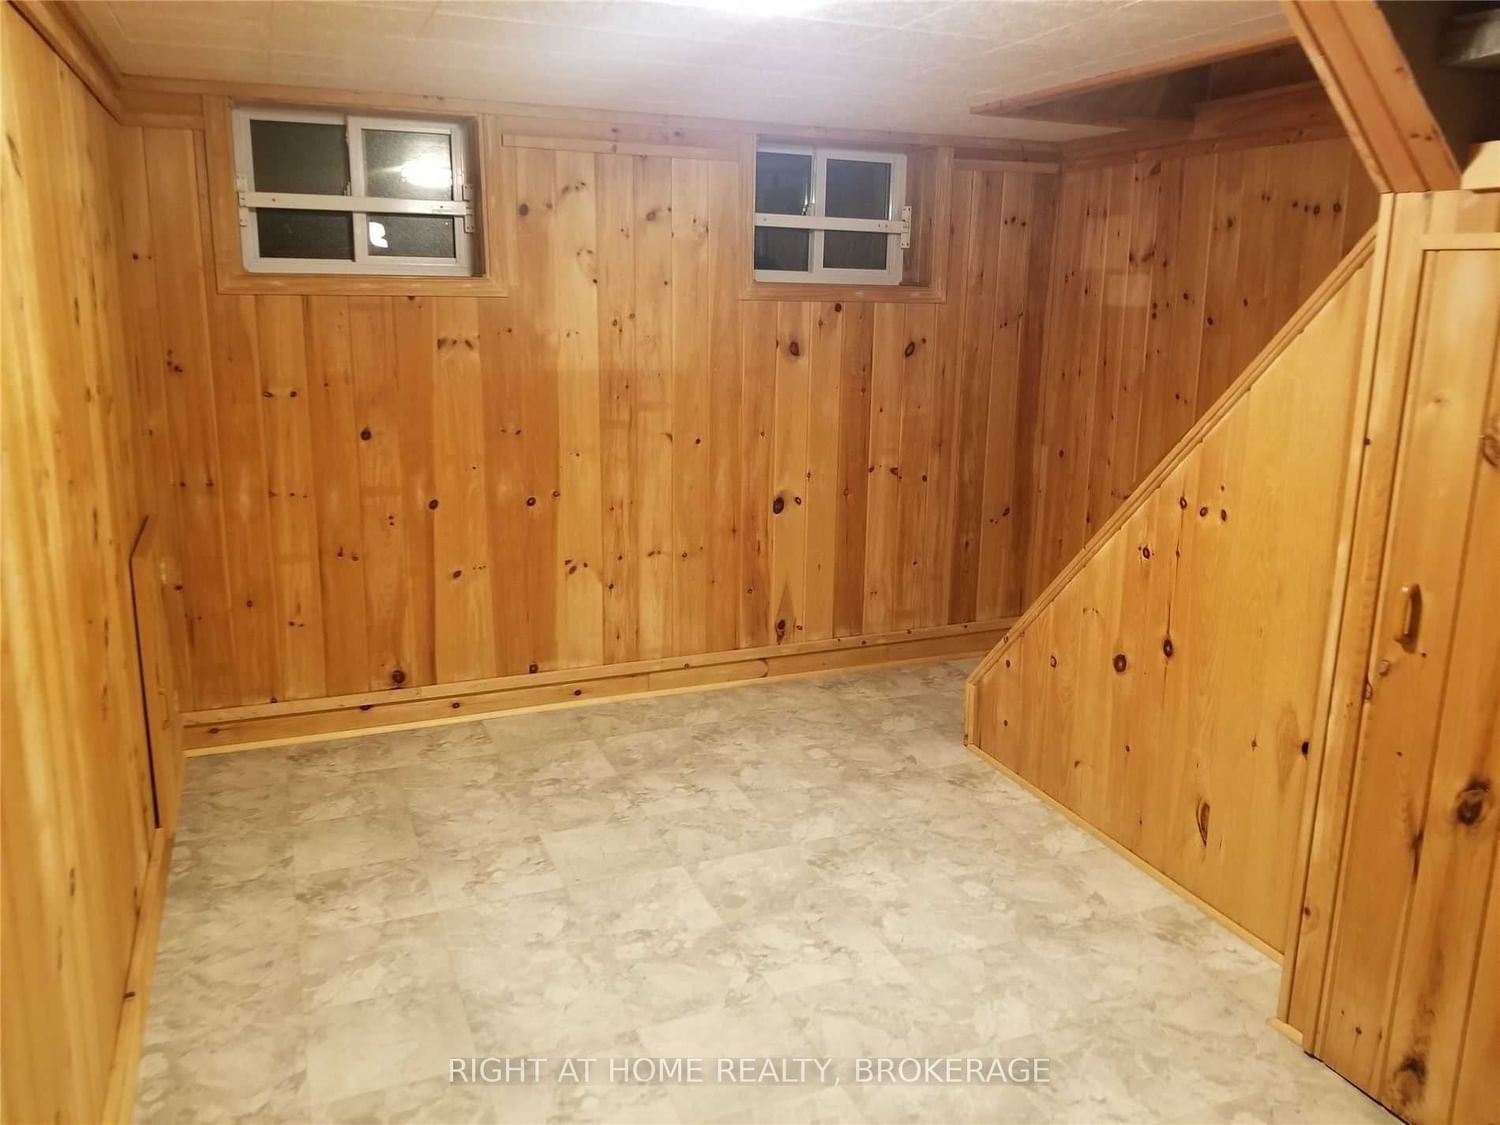
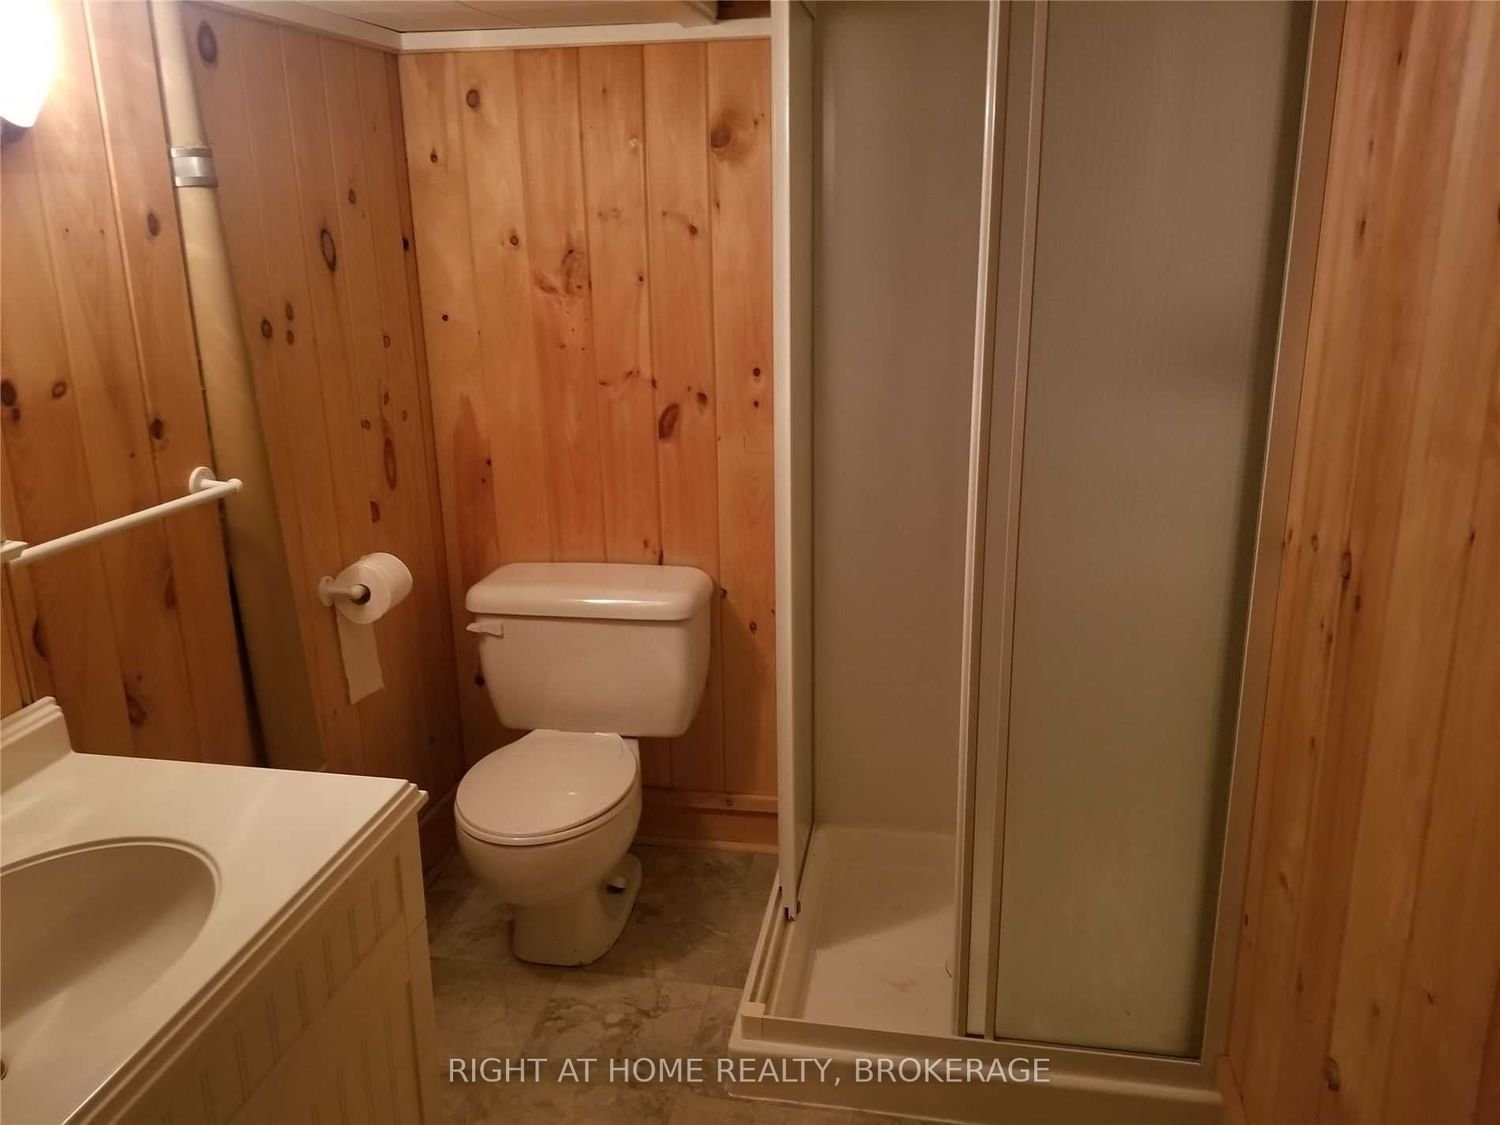
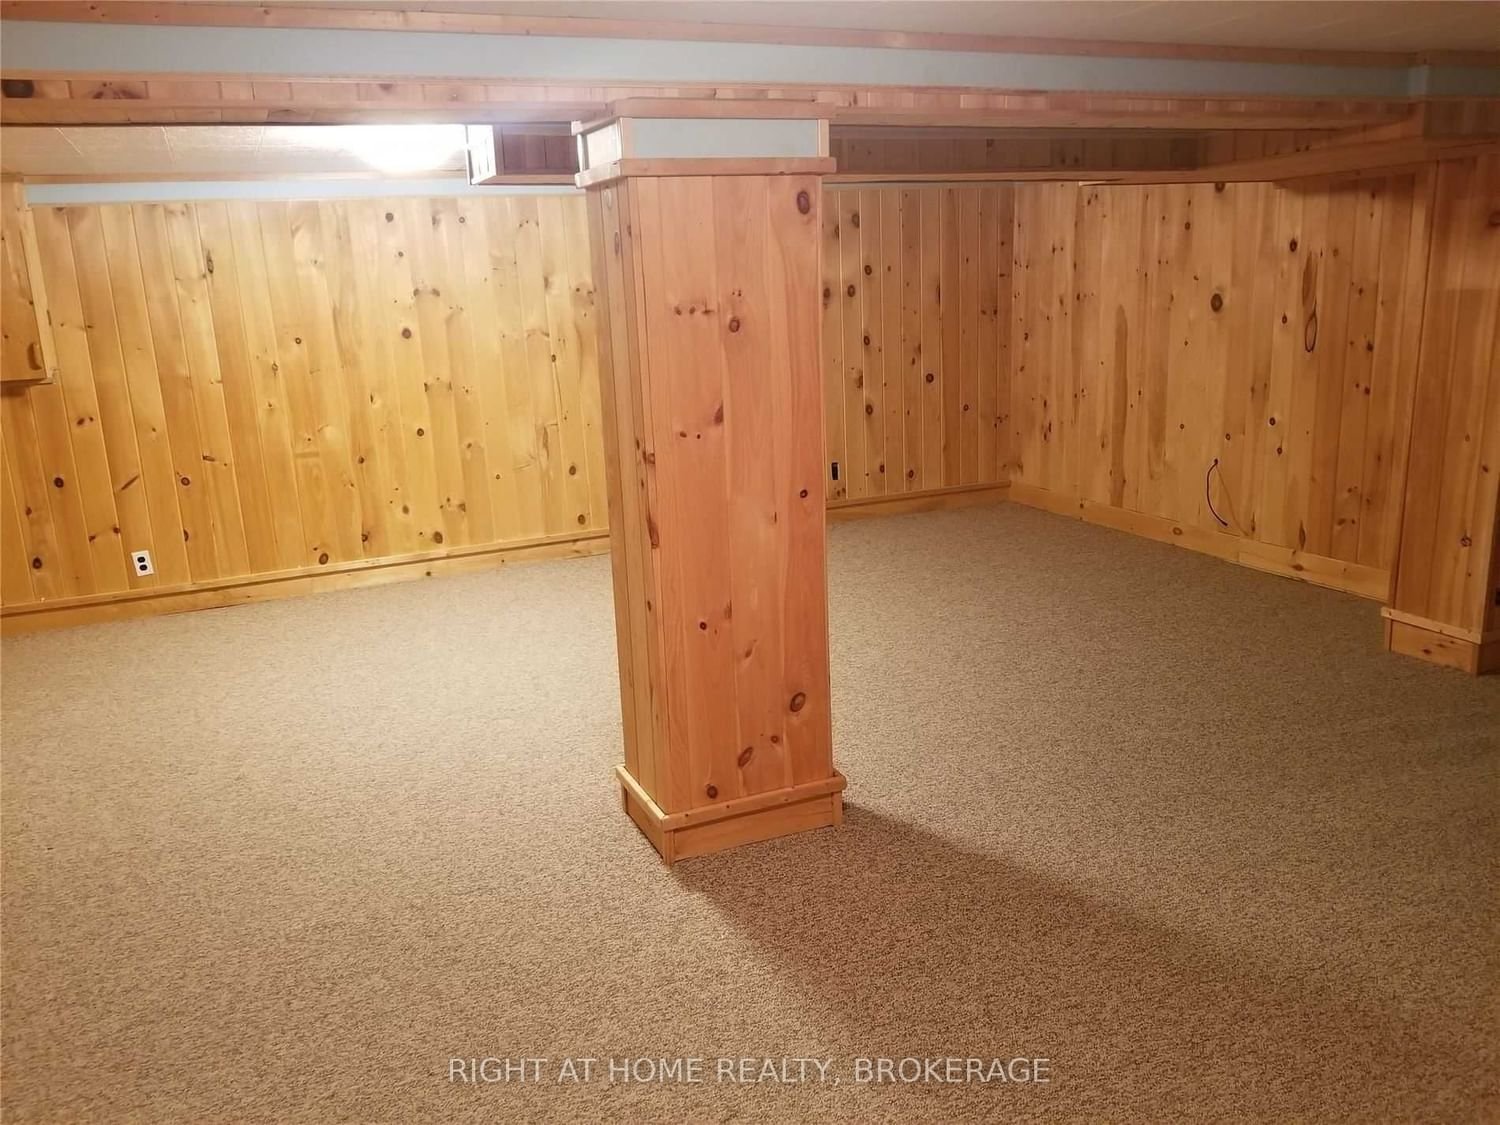
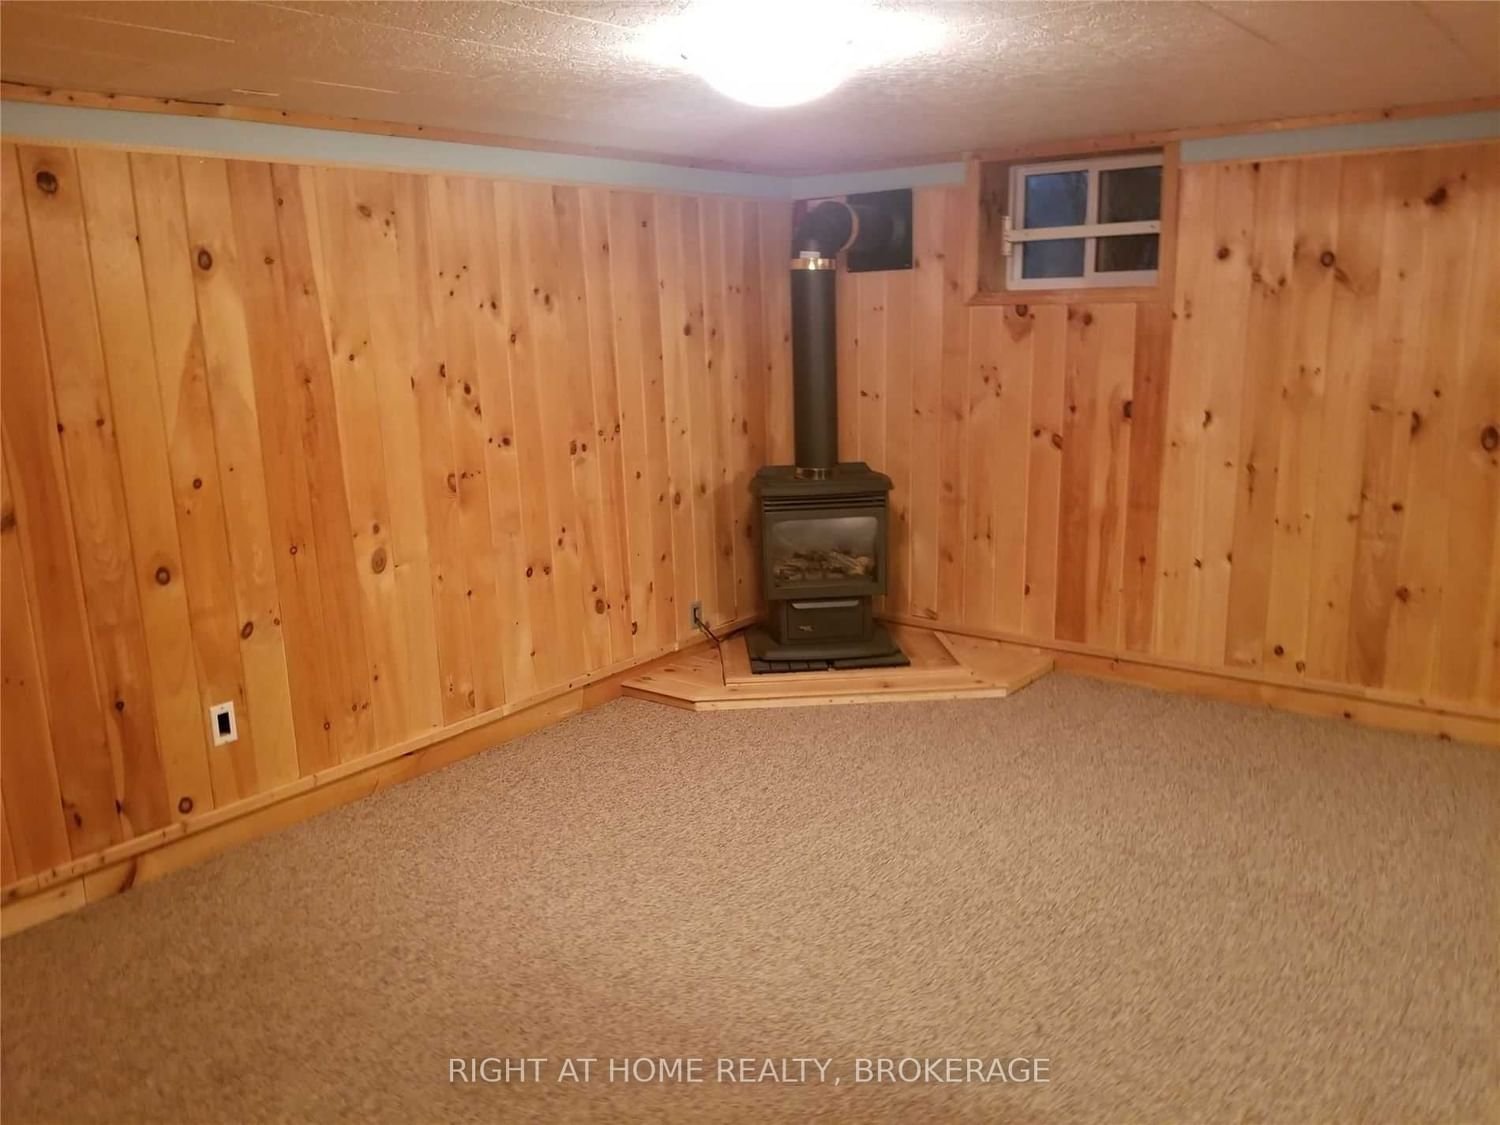
- Basement
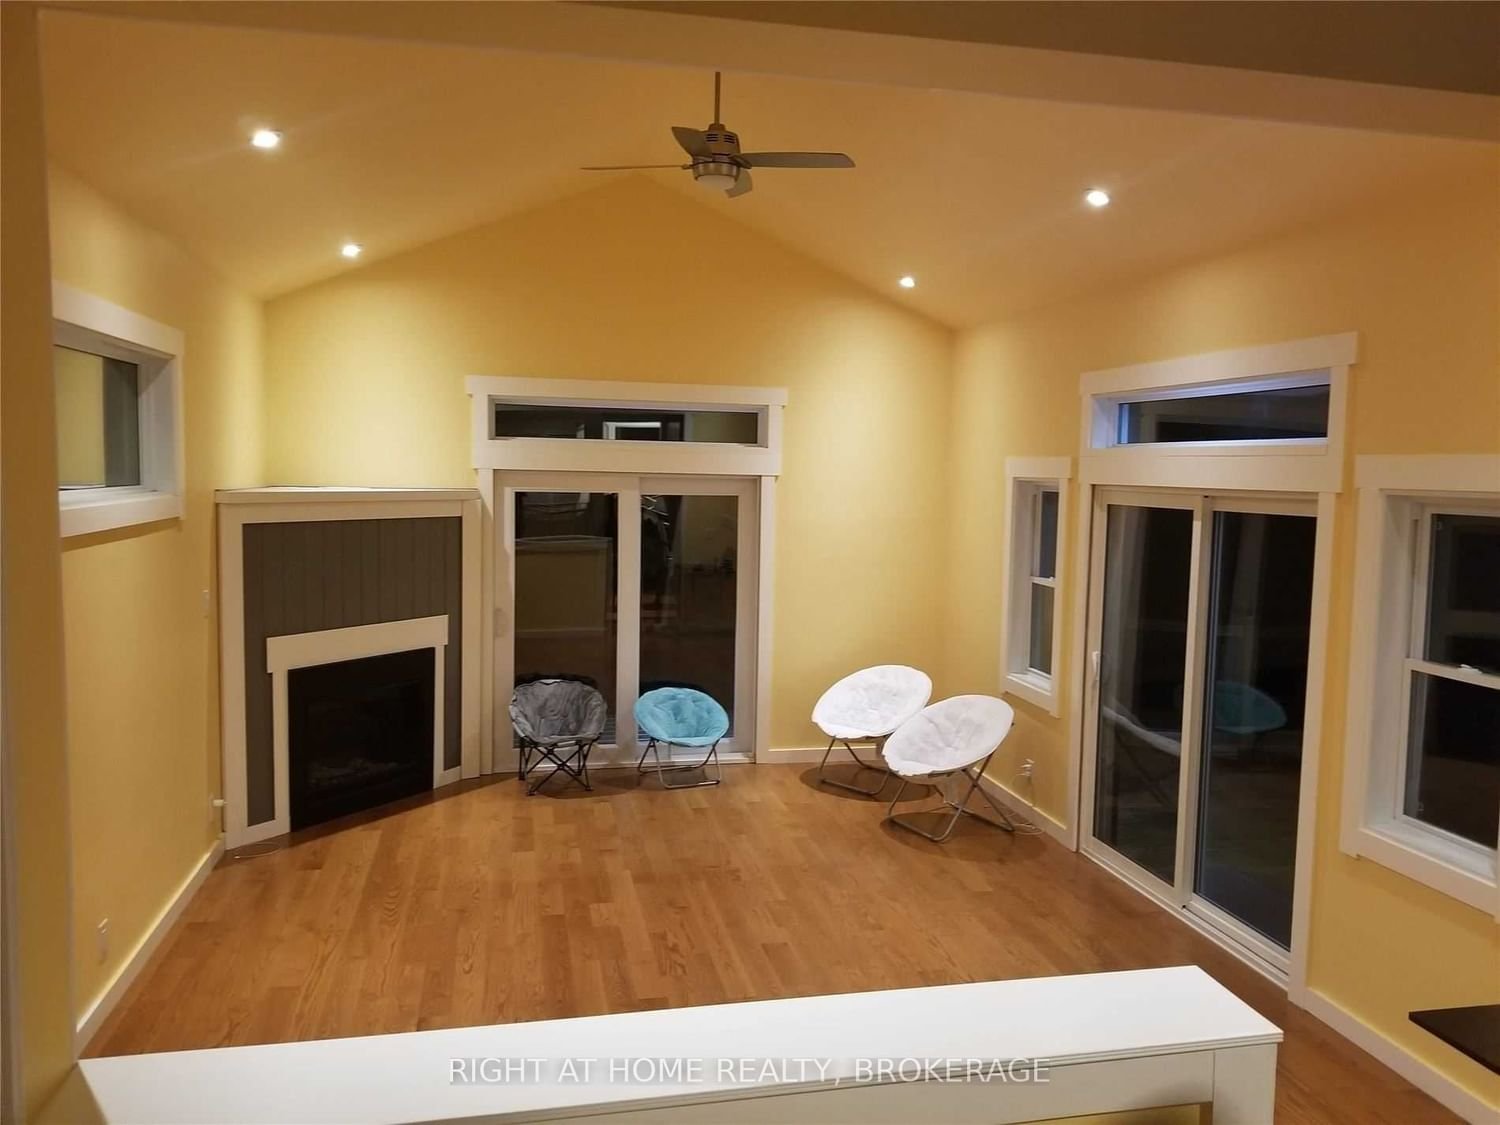
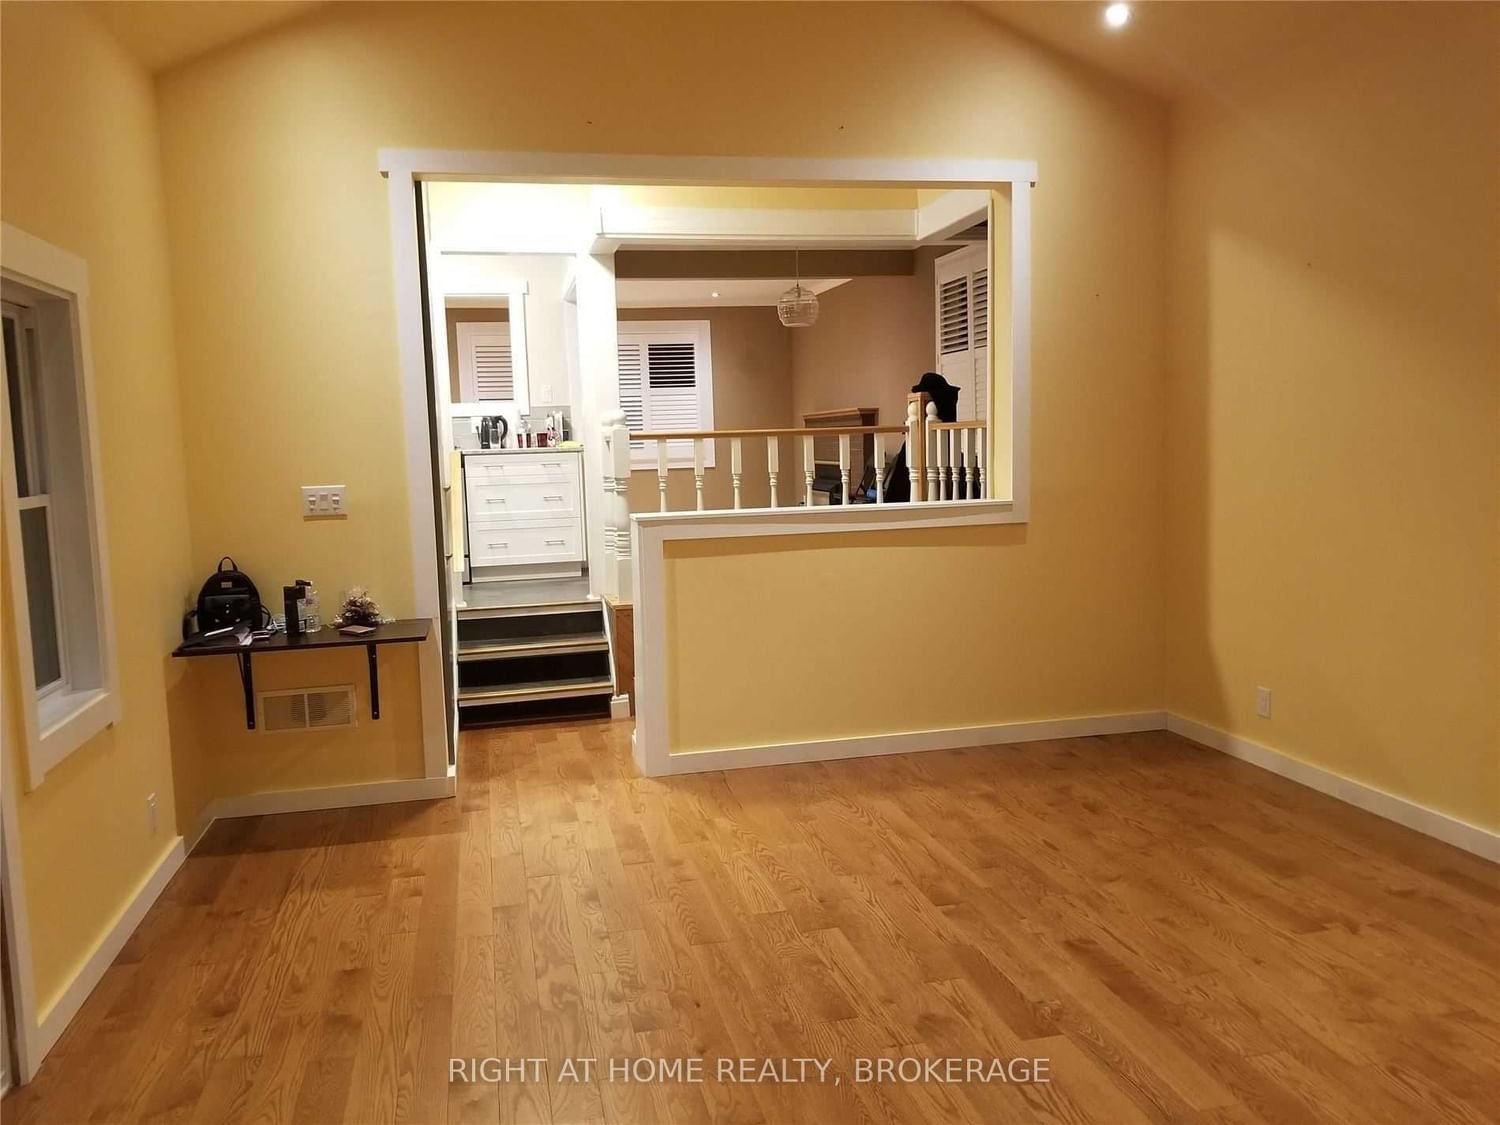
- Finished
- Age
- No Data
Utility Type
- Air Conditioning
- Central Air
- Heat Source
- Gas
- Heating
- Forced Air
Land
- Fronting On
- No Data
- Lot Frontage & Depth (FT)
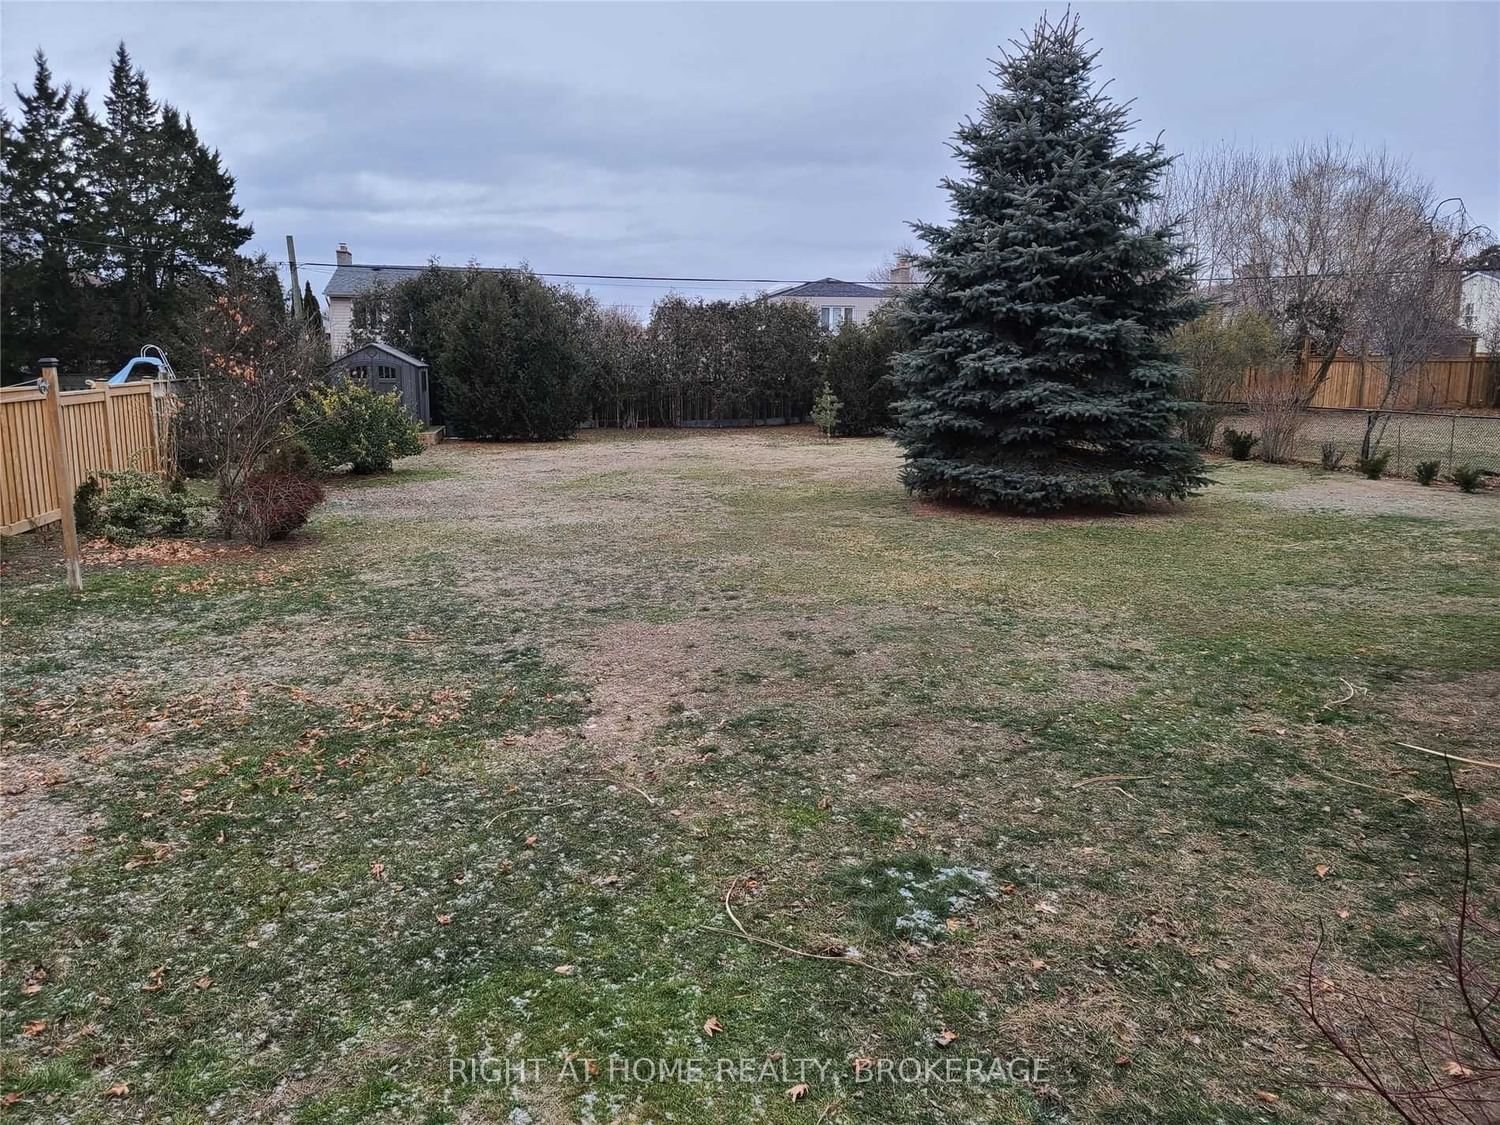
- 75 x 200
- Lot Total (SQFT)
- 15,000
- Pool
- None
- Intersecting Streets
- Liverpool & Finch
Nearby Amenities
5/10
Walkability
Halfway to a walker's paradise, you might want to invest in a hoverboard.
Unknown
Transit
3/10
Bikeability
Your bike will know every pothole personally. It's that intimate.
Demographics
Based on the dissemination area as defined by Statistics Canada. A dissemination area contains, on average, approximately 200 – 400 households.
Population
2,814
Average Individual Income
$62,454
Average Household Size
3 persons
Average Age
41
Average Household Income
$116,046
Dominant Housing Type
Detached
Population By Age
Household Income
Housing Types & Tenancy
Detached
64%
High Rise Apartment
25%
Duplex
7%
Low Rise Apartment
1%
Semi Detached
1%
Marital Status
Commute
Languages (Primary Language)
English
80%
Other
8%
Urdu
4%
Tamil
4%
Tagalog
3%
Mandarin
1%
Education
High School
31%
University and Above
24%
College
20%
None
14%
Apprenticeship
5%
University Below Batchelor
2%
Major Field of Study
Business Management
23%
Architecture & Engineering
22%
Social Sciences
15%
Health & Related Fields
12%
Personal, Protective & Transportation Services
5%
Math & Computer Sciences
4%
Humanities
3%
Physical Sciences
3%
Education
3%
Visual & Performing Arts
2%
Agriculture & Natural Resources
1%
Price Trends
Liverpool Trends
Days on Strata
Houses spend an average of
11
Days on Market
based on recent sales
List vs Selling Price
On average, houses sell for
6%
above
the list price
Offer Competition
Houses have a
HIGHChance of receiving
Multiple Offers
Sales Volume
Liverpool has the
3rd
Highest number of sales transactions among 12 neighbourhoods in the Pickering area
Property Value
3%
Increase in property values within the past twelve months
Price Ranking
7th
Highest average house price out of 12 neighbourhoods in the Pickering area
Sold Houses
89
Houses were sold over the past twelve months
Rented Houses
30
Houses were rented over the past twelve months
Sales Trends in Liverpool
| House Type | Detached | Semi-Detached | Row Townhouse |
|---|---|---|---|
| Avg. Sales Availability | 5 Days | 29 Days | 54 Days |
| Sales Price Range | $843,000 - $1,955,000 | $815,000 - $962,000 | $725,000 - $960,500 |
| Avg. Rental Availability | 28 Days | 184 Days | 174 Days |
| Rental Price Range | $1,600 - $4,000 | $1,350 - $4,000 | $2,800 - $3,300 |


