913 - 20 Minowan Miikan Lane
Listing History
Unit Highlights
Utilities Included
Utility Type
- Air Conditioning
- Central Air
- Heat Source
- Gas
- Heating
- Forced Air
Room Dimensions
About this Listing
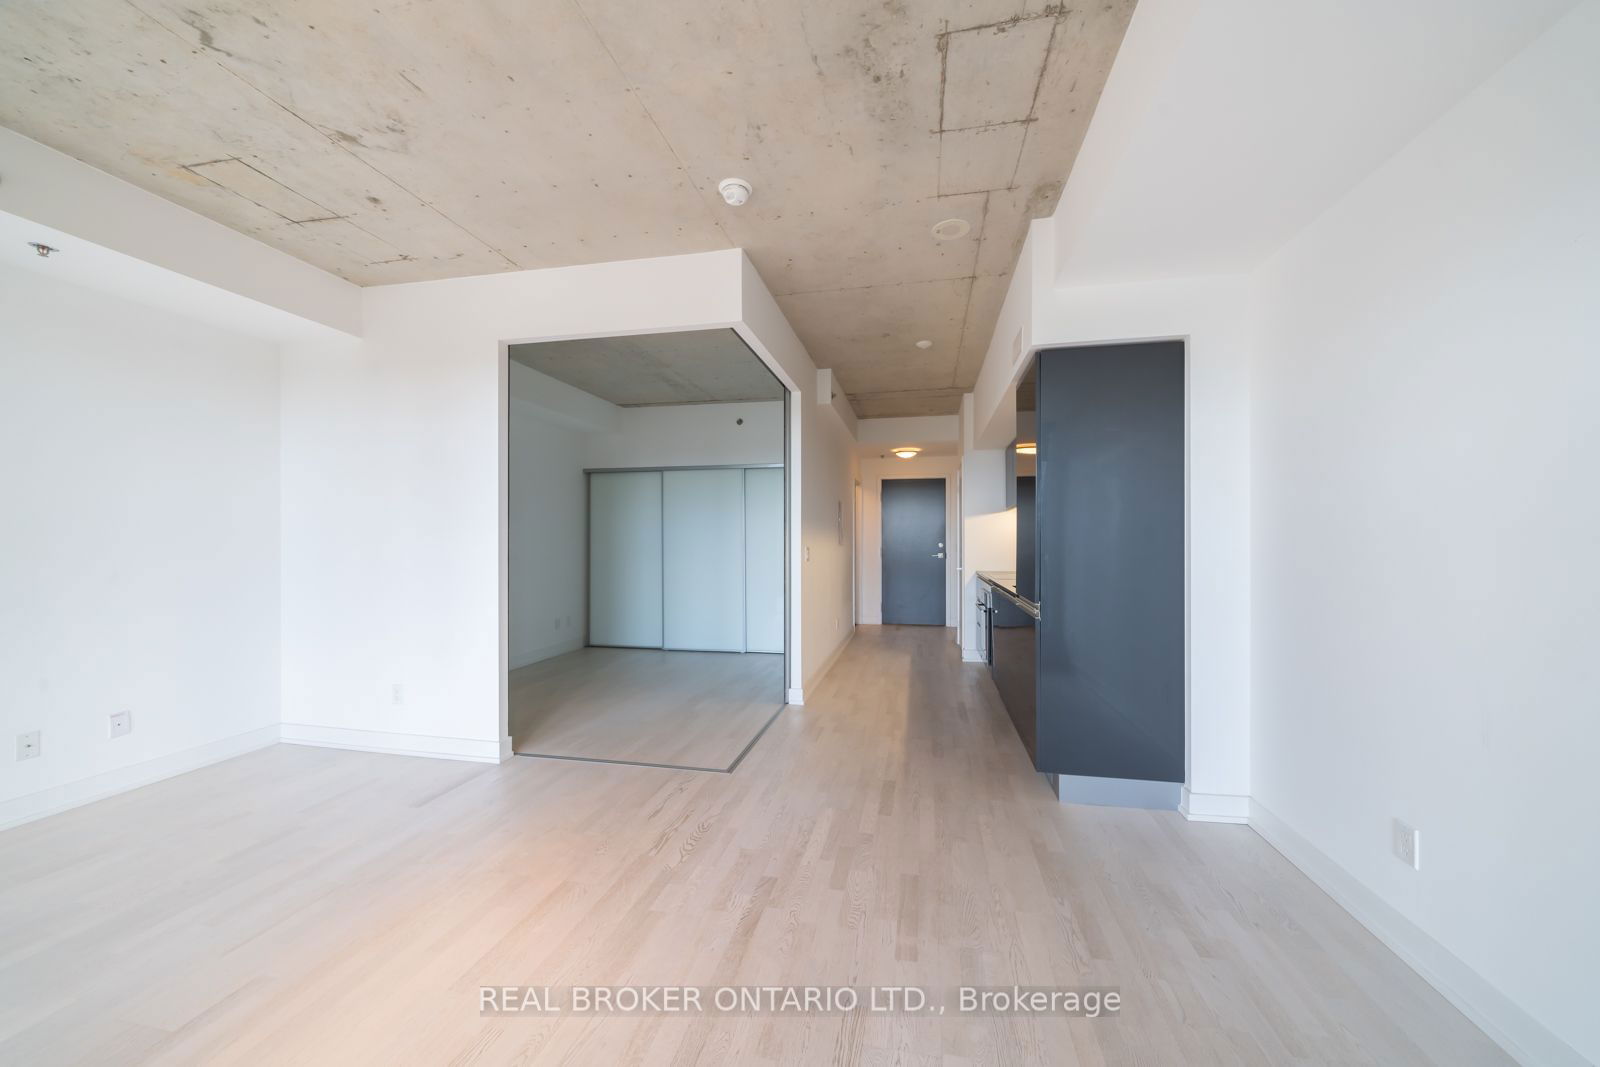
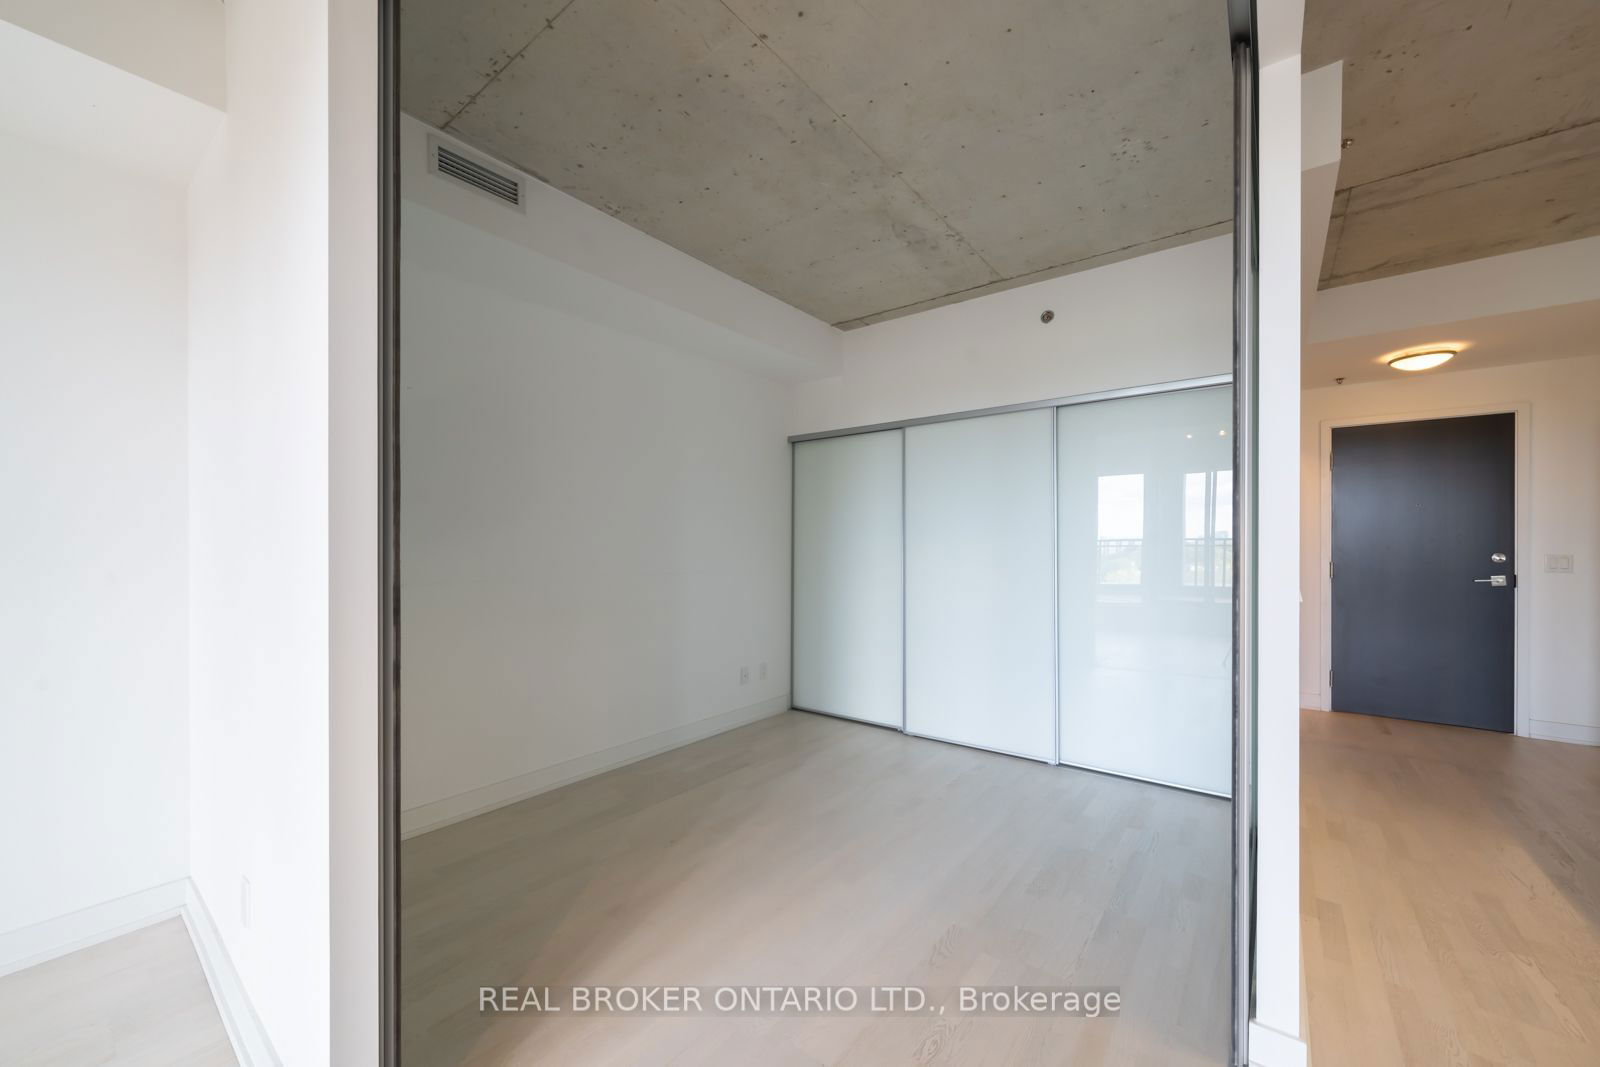
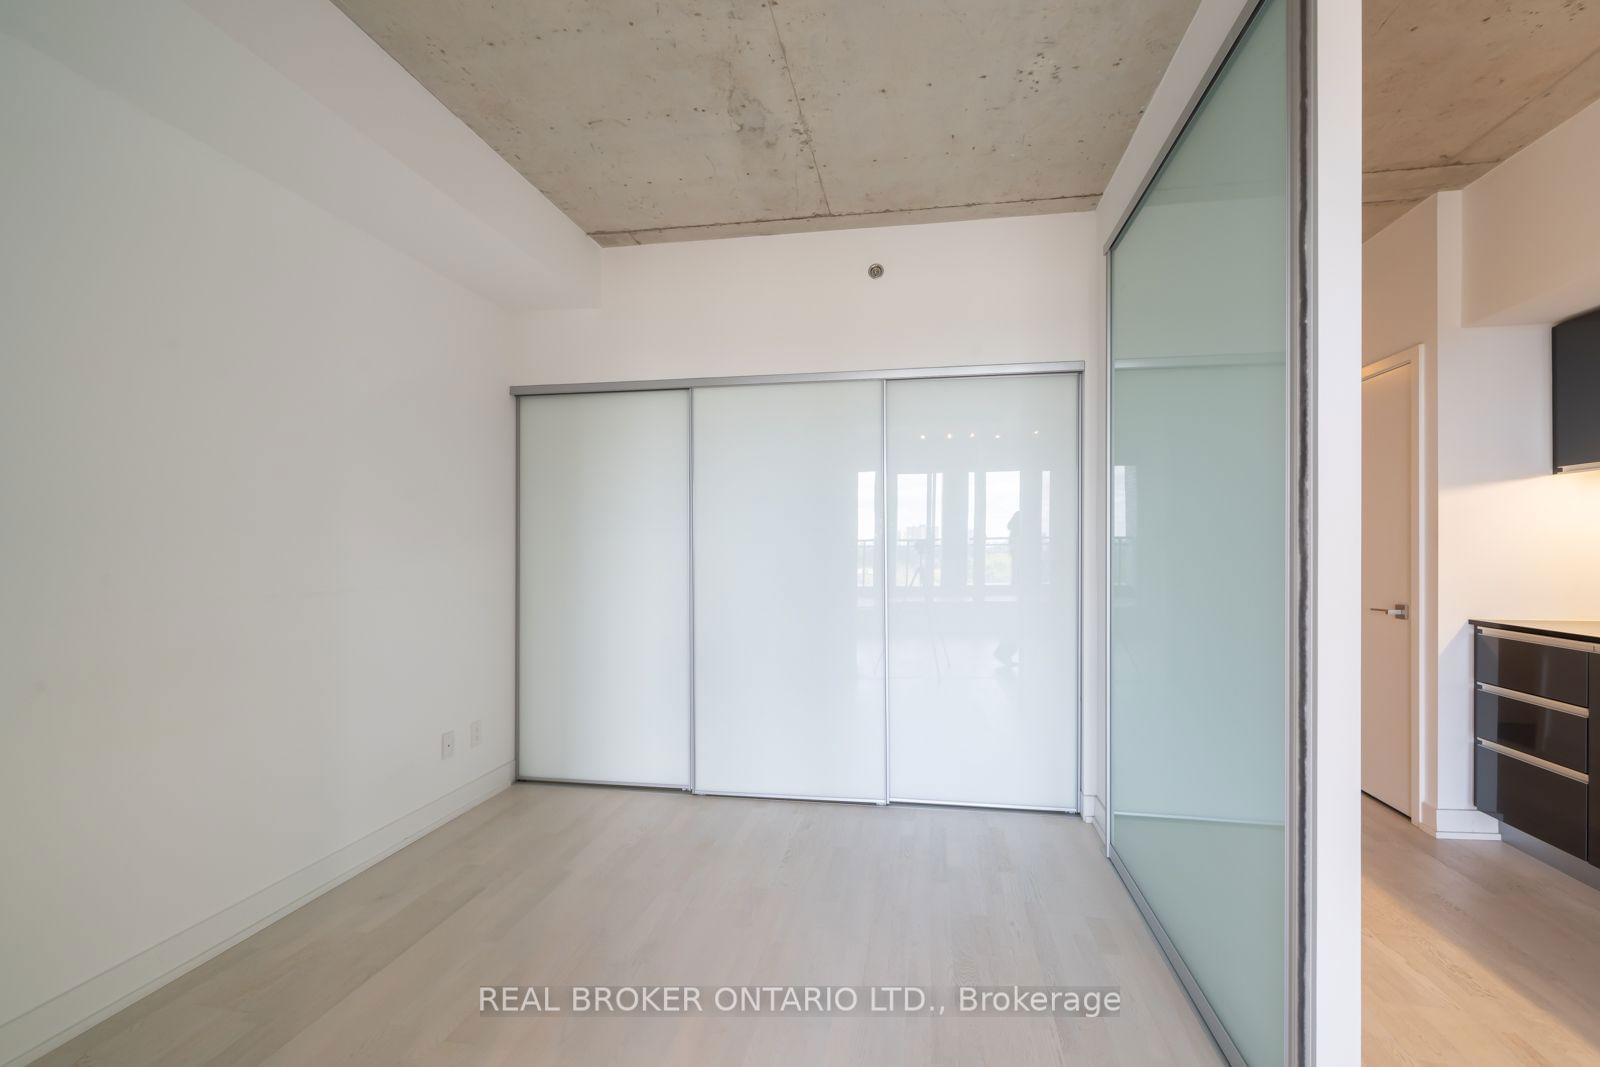
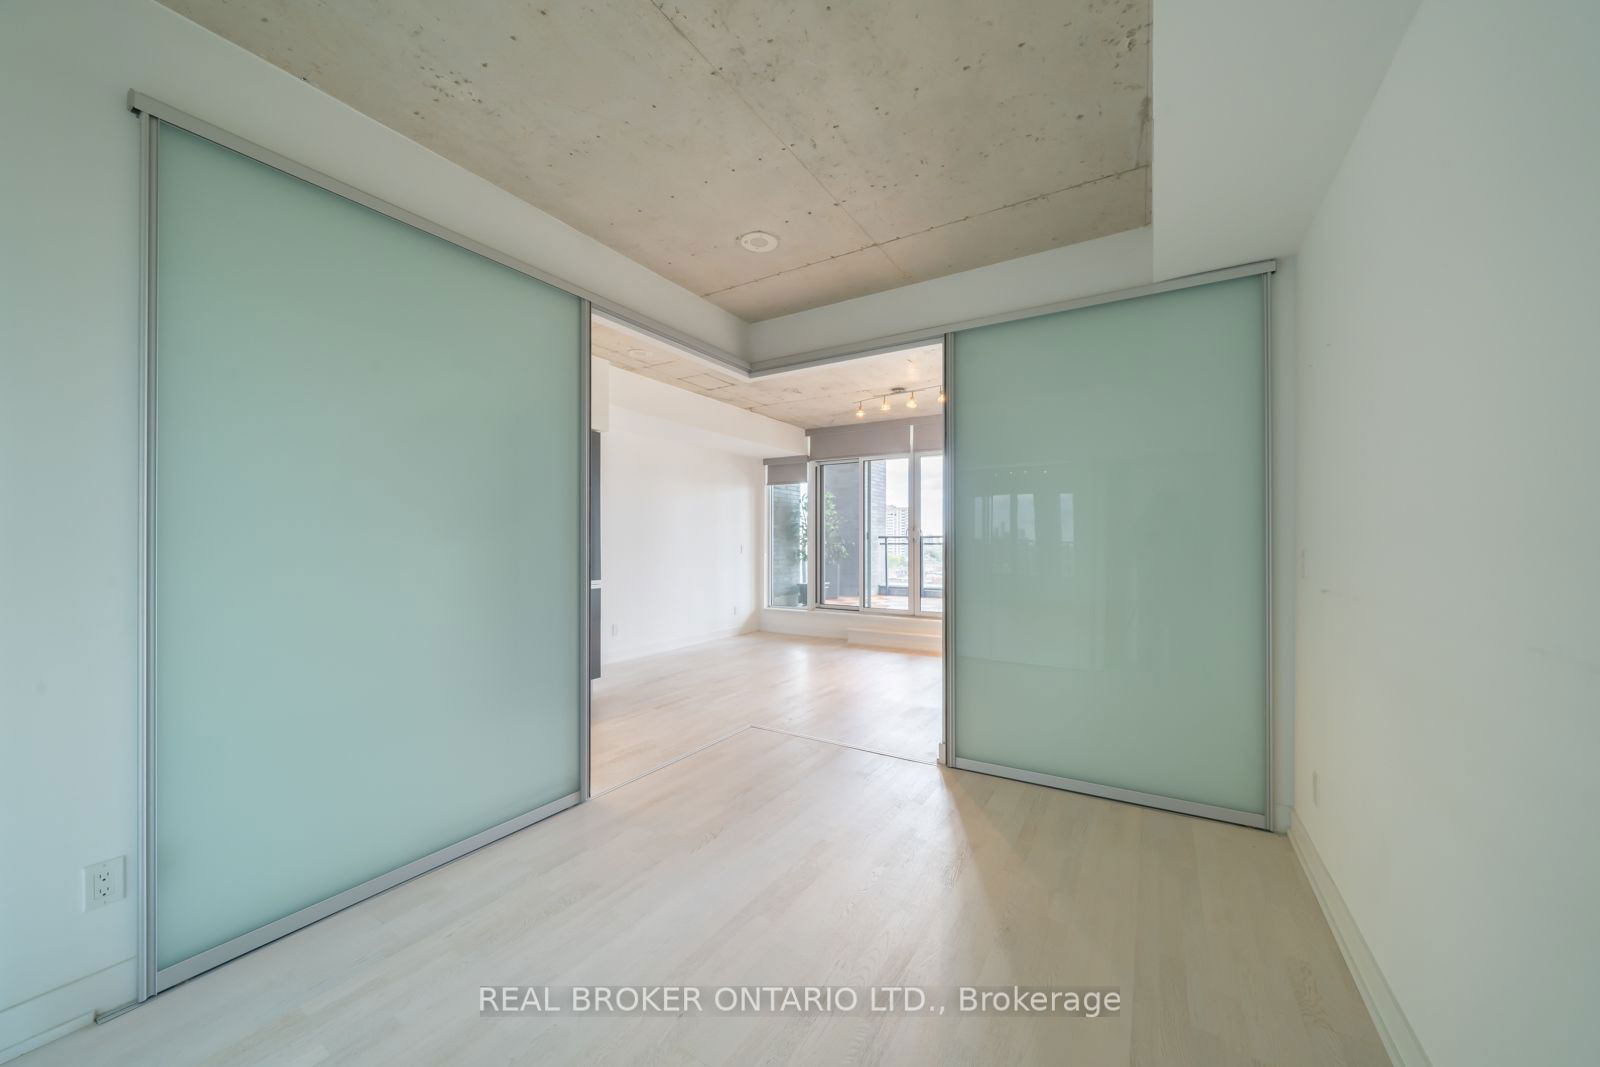
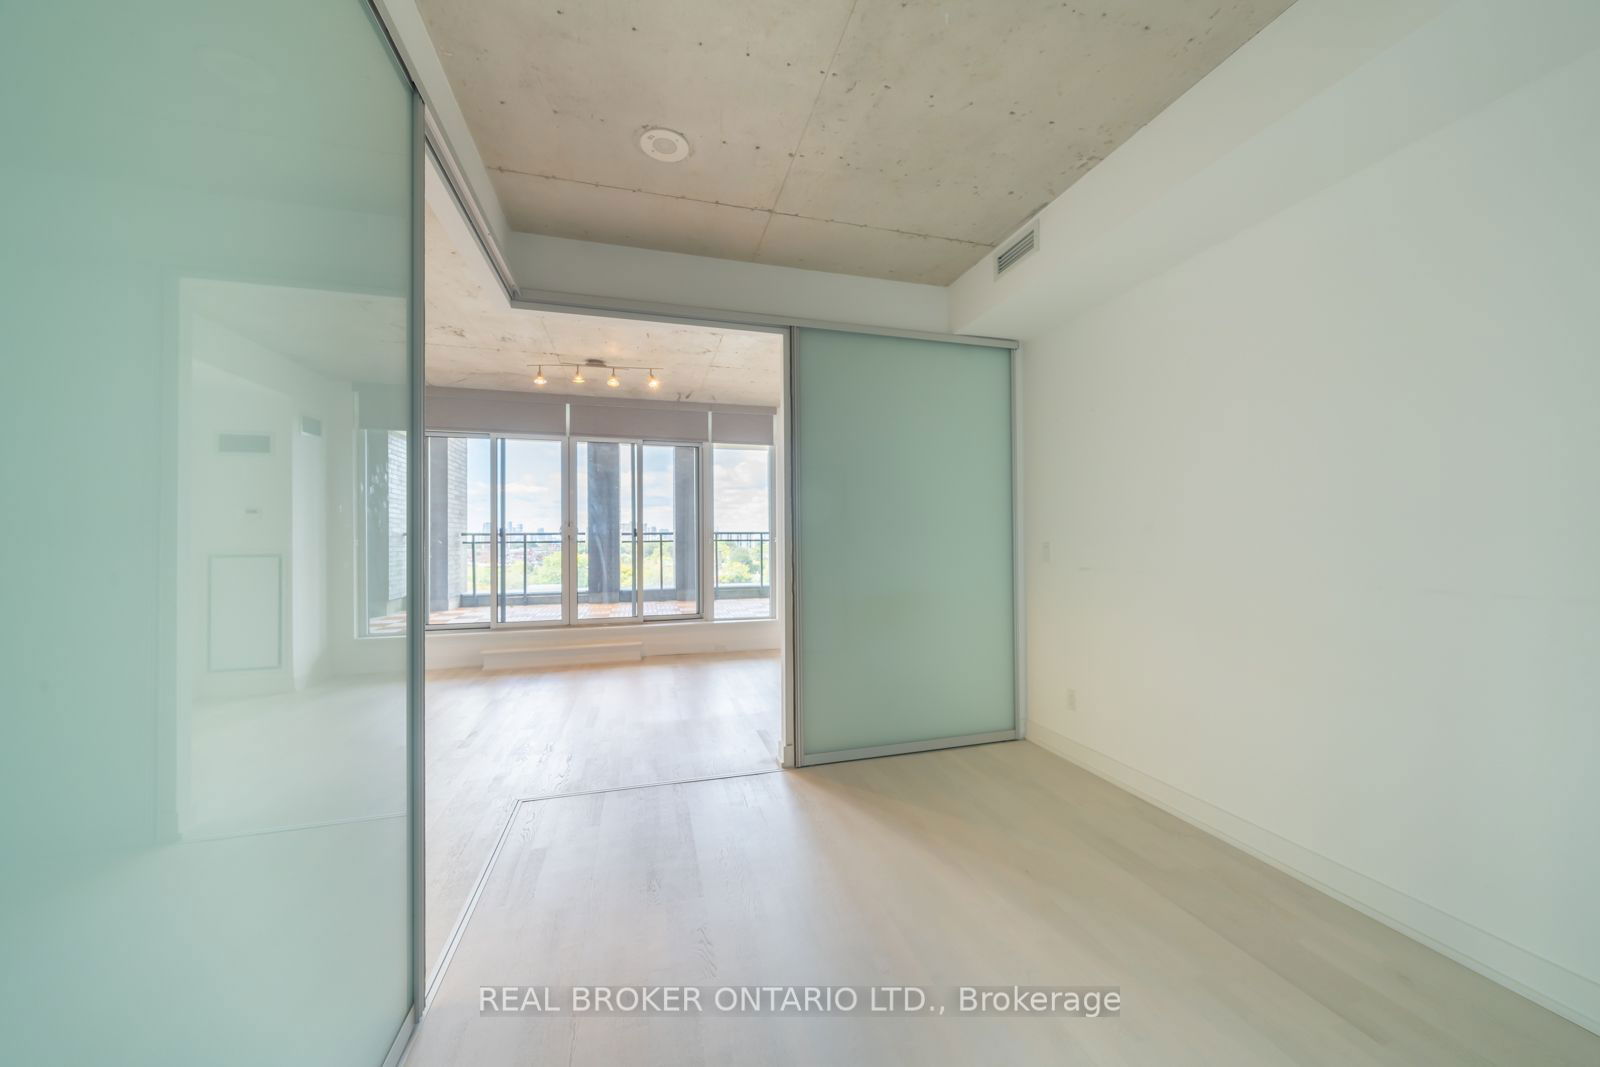
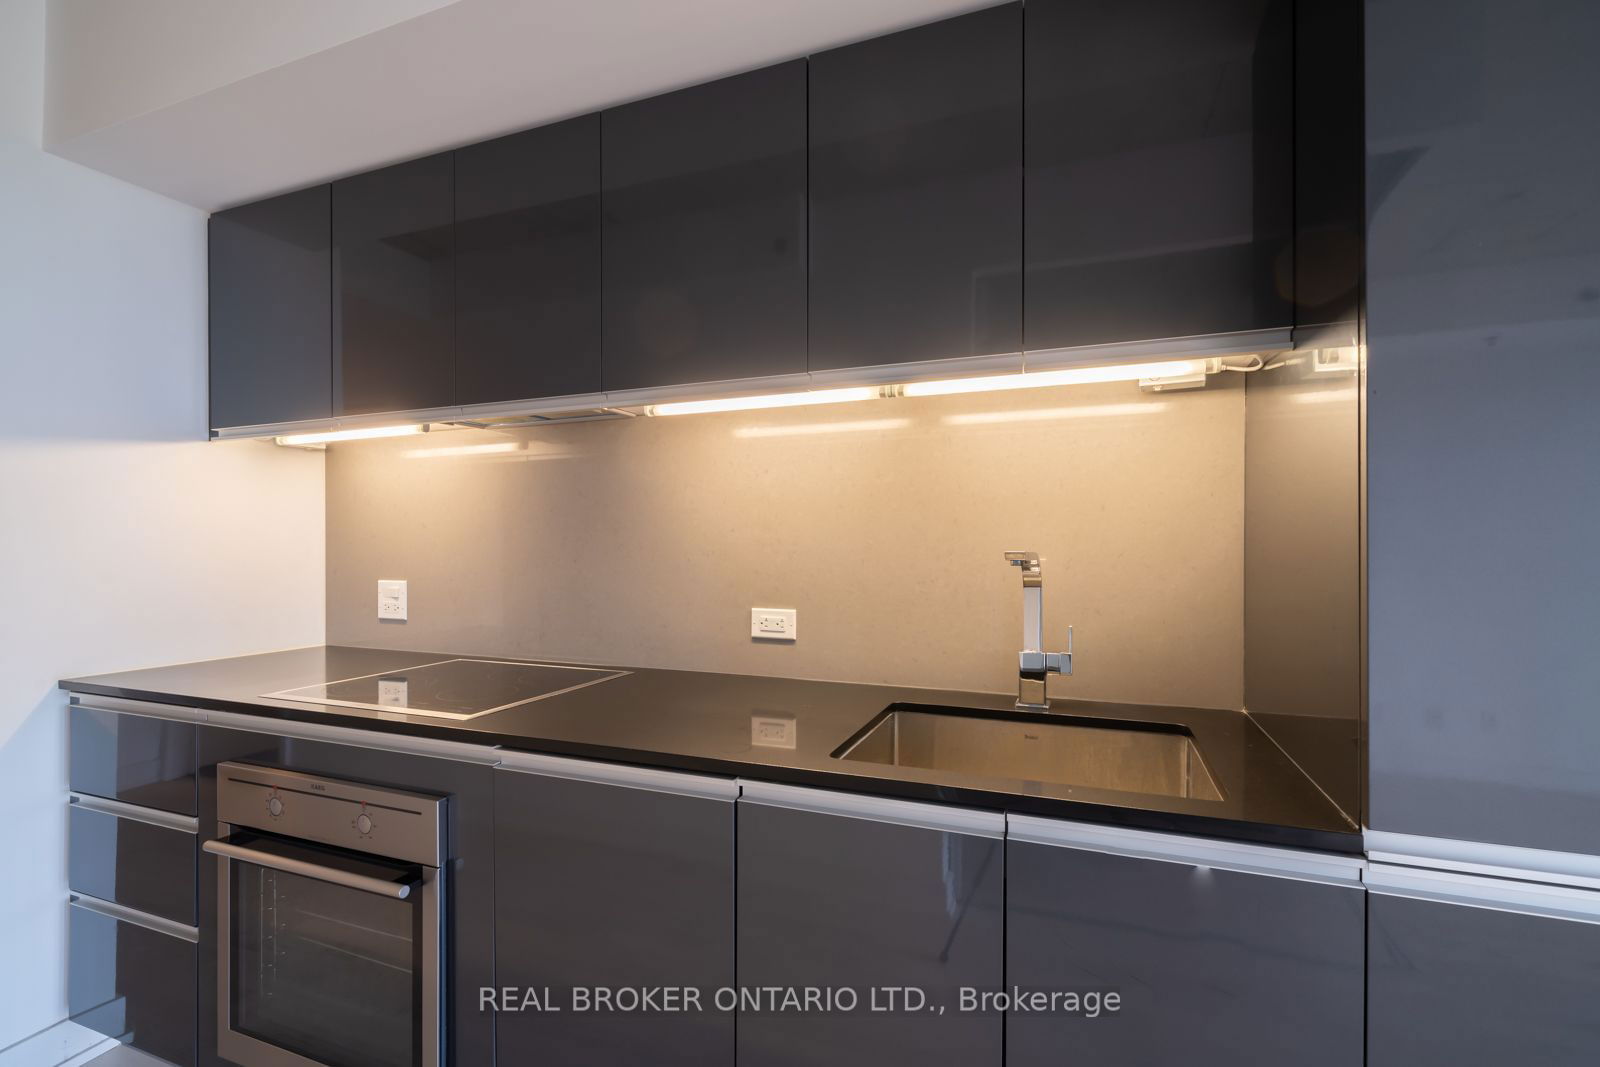
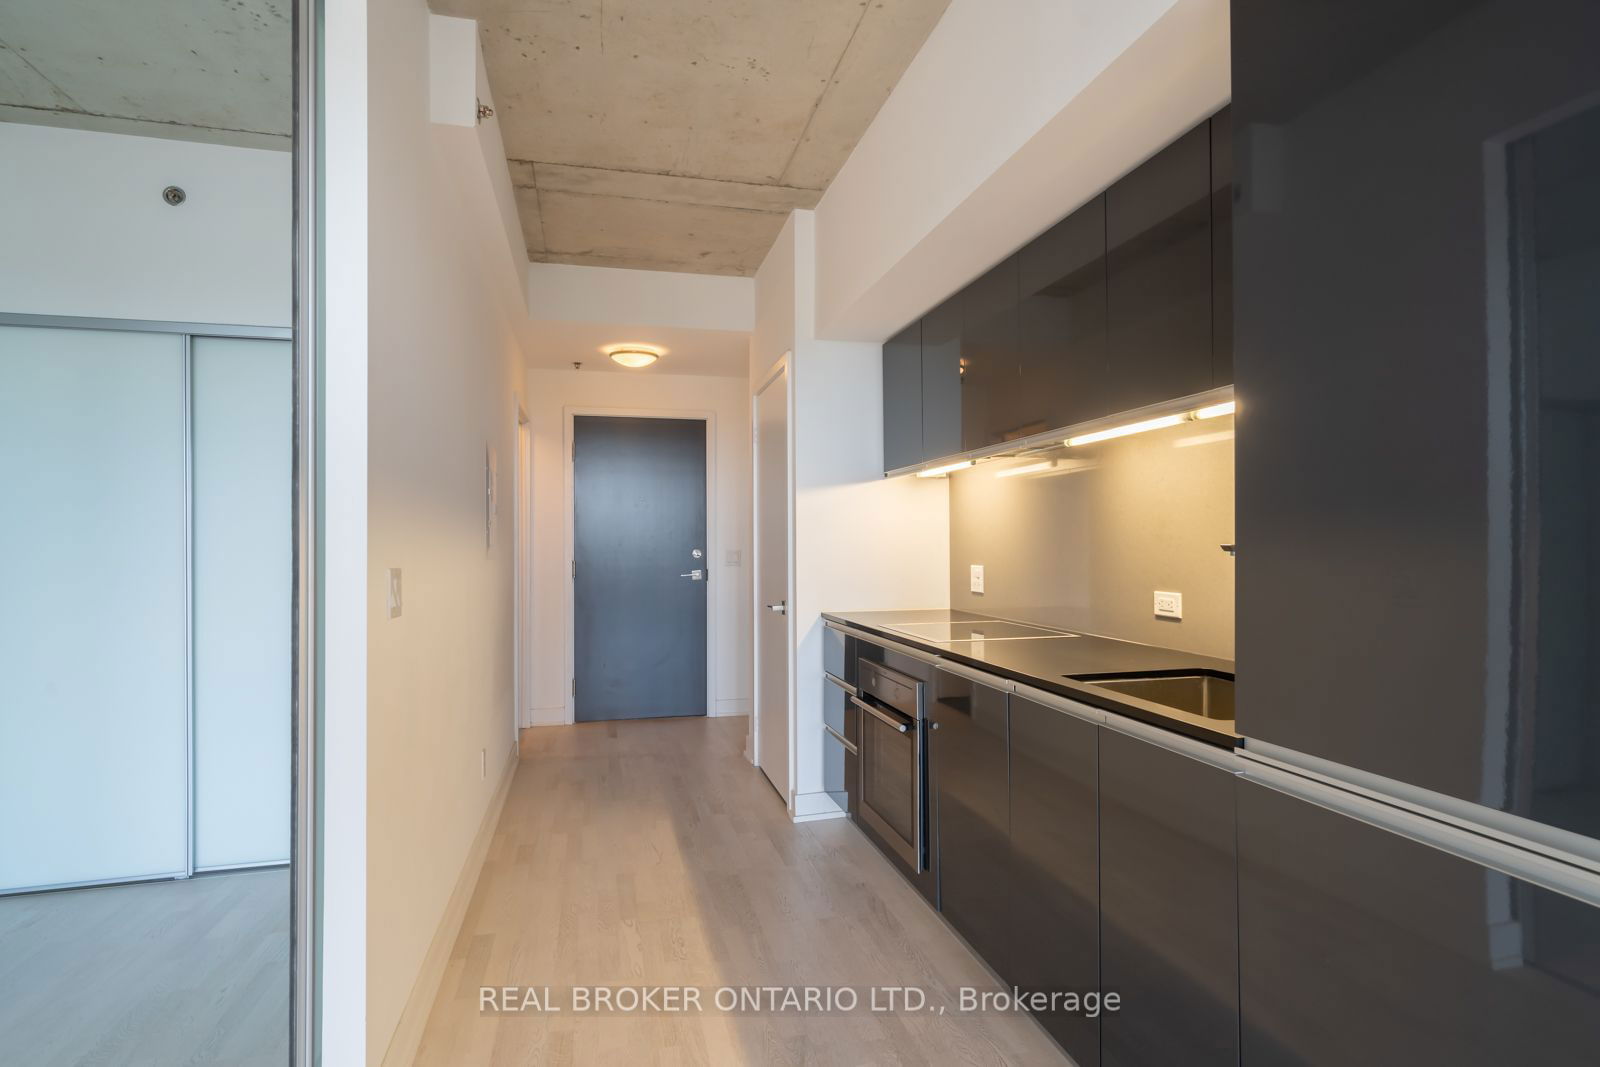
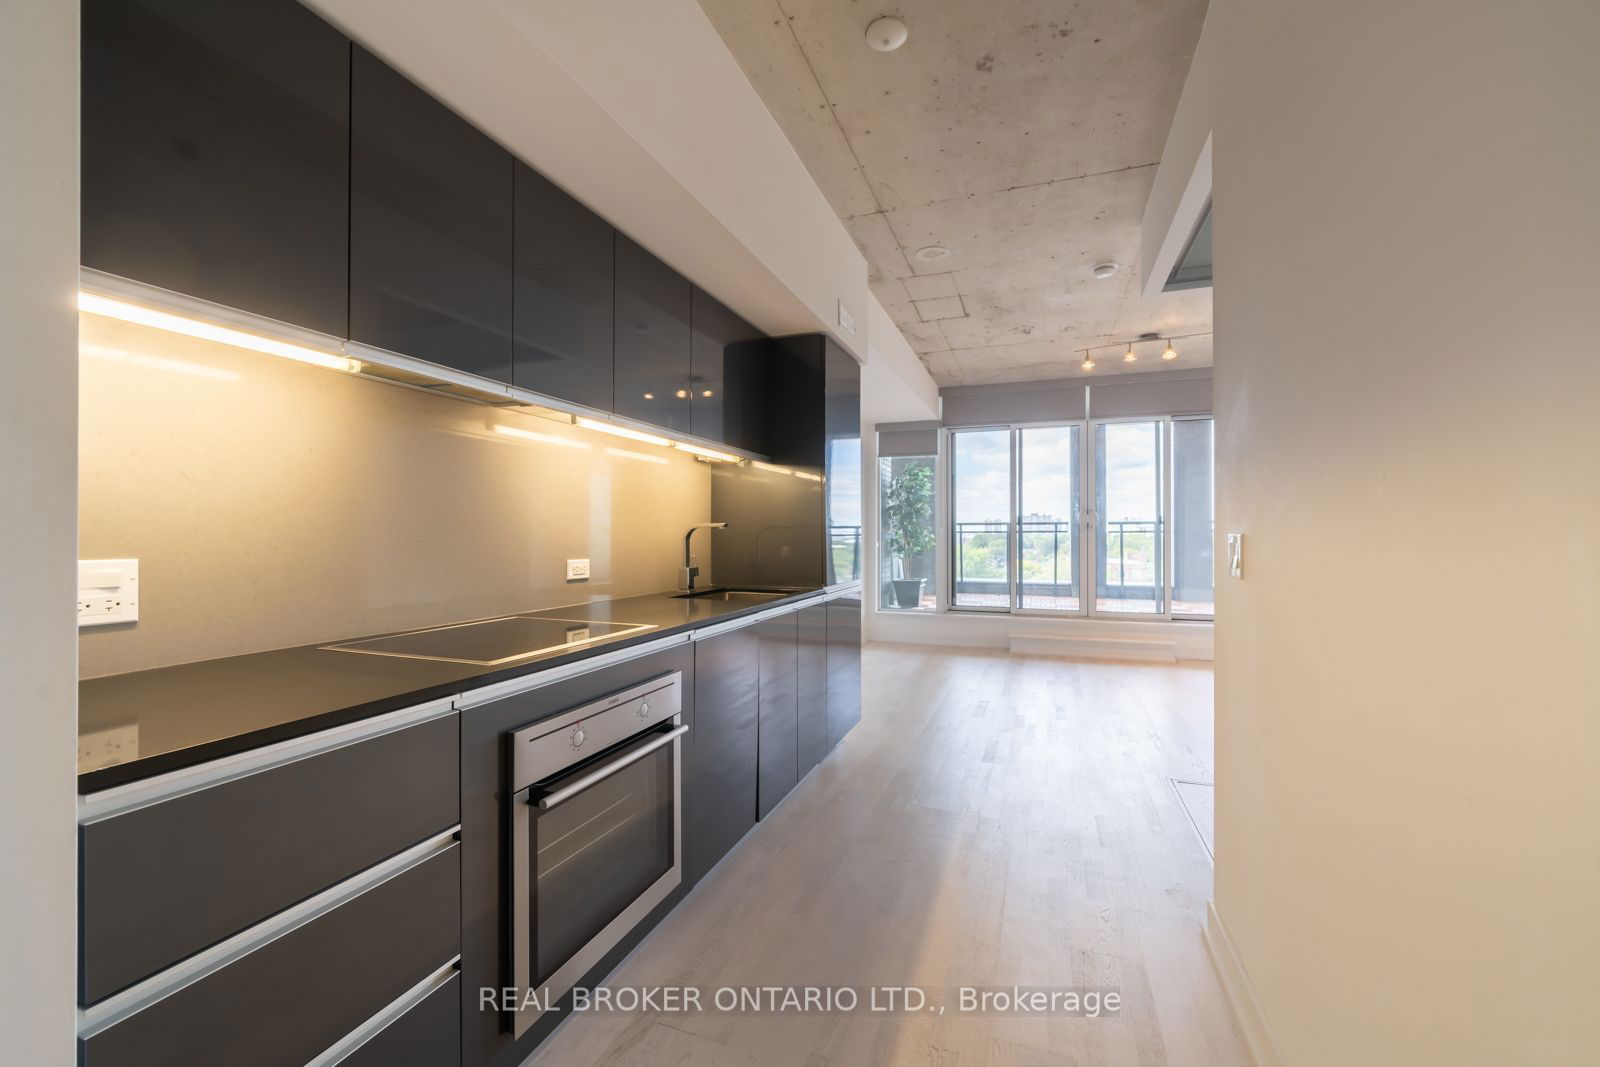
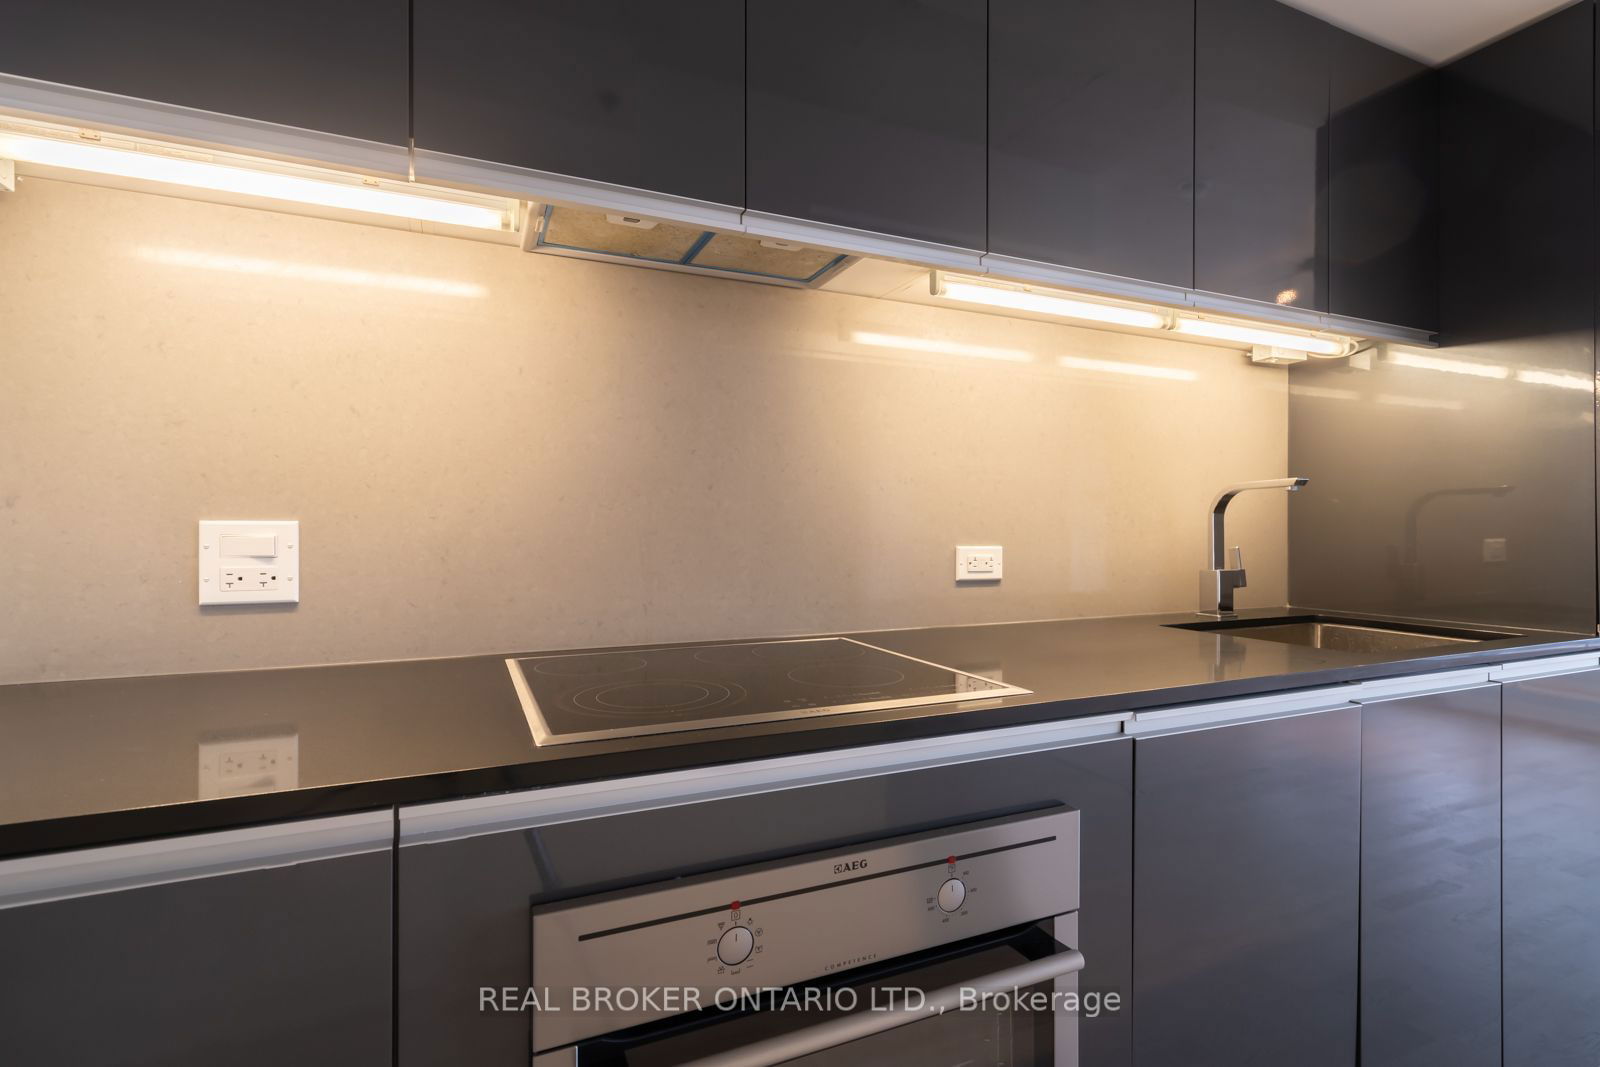
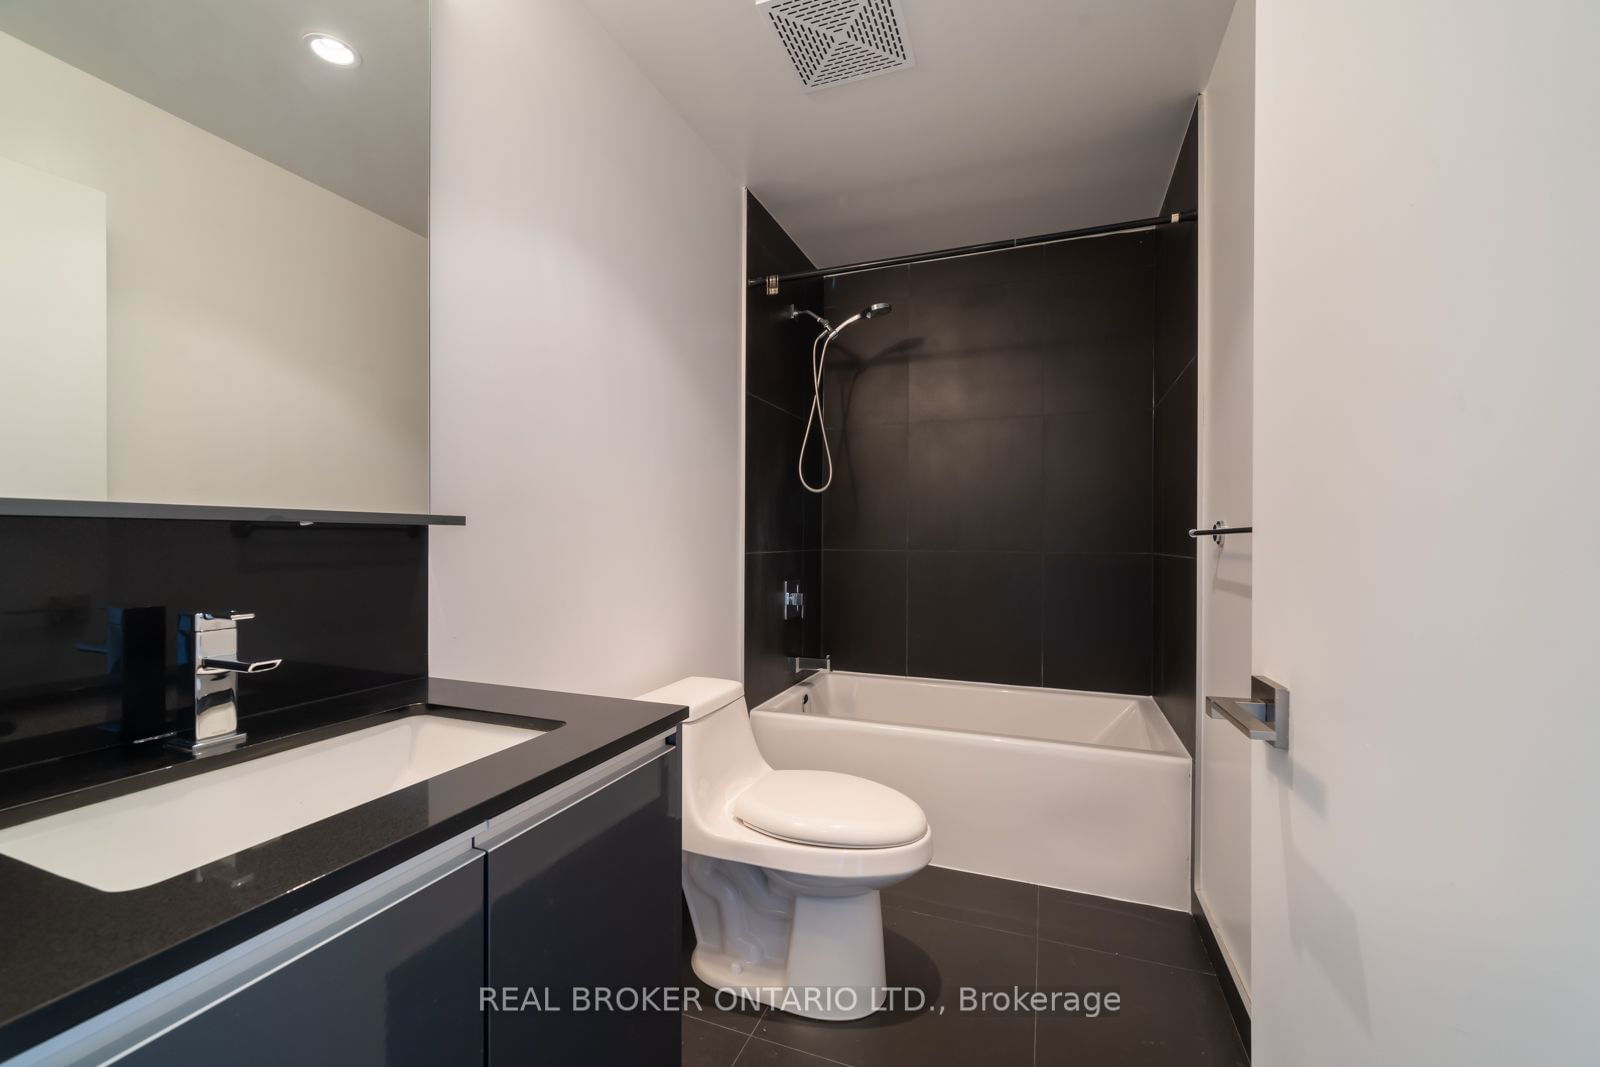
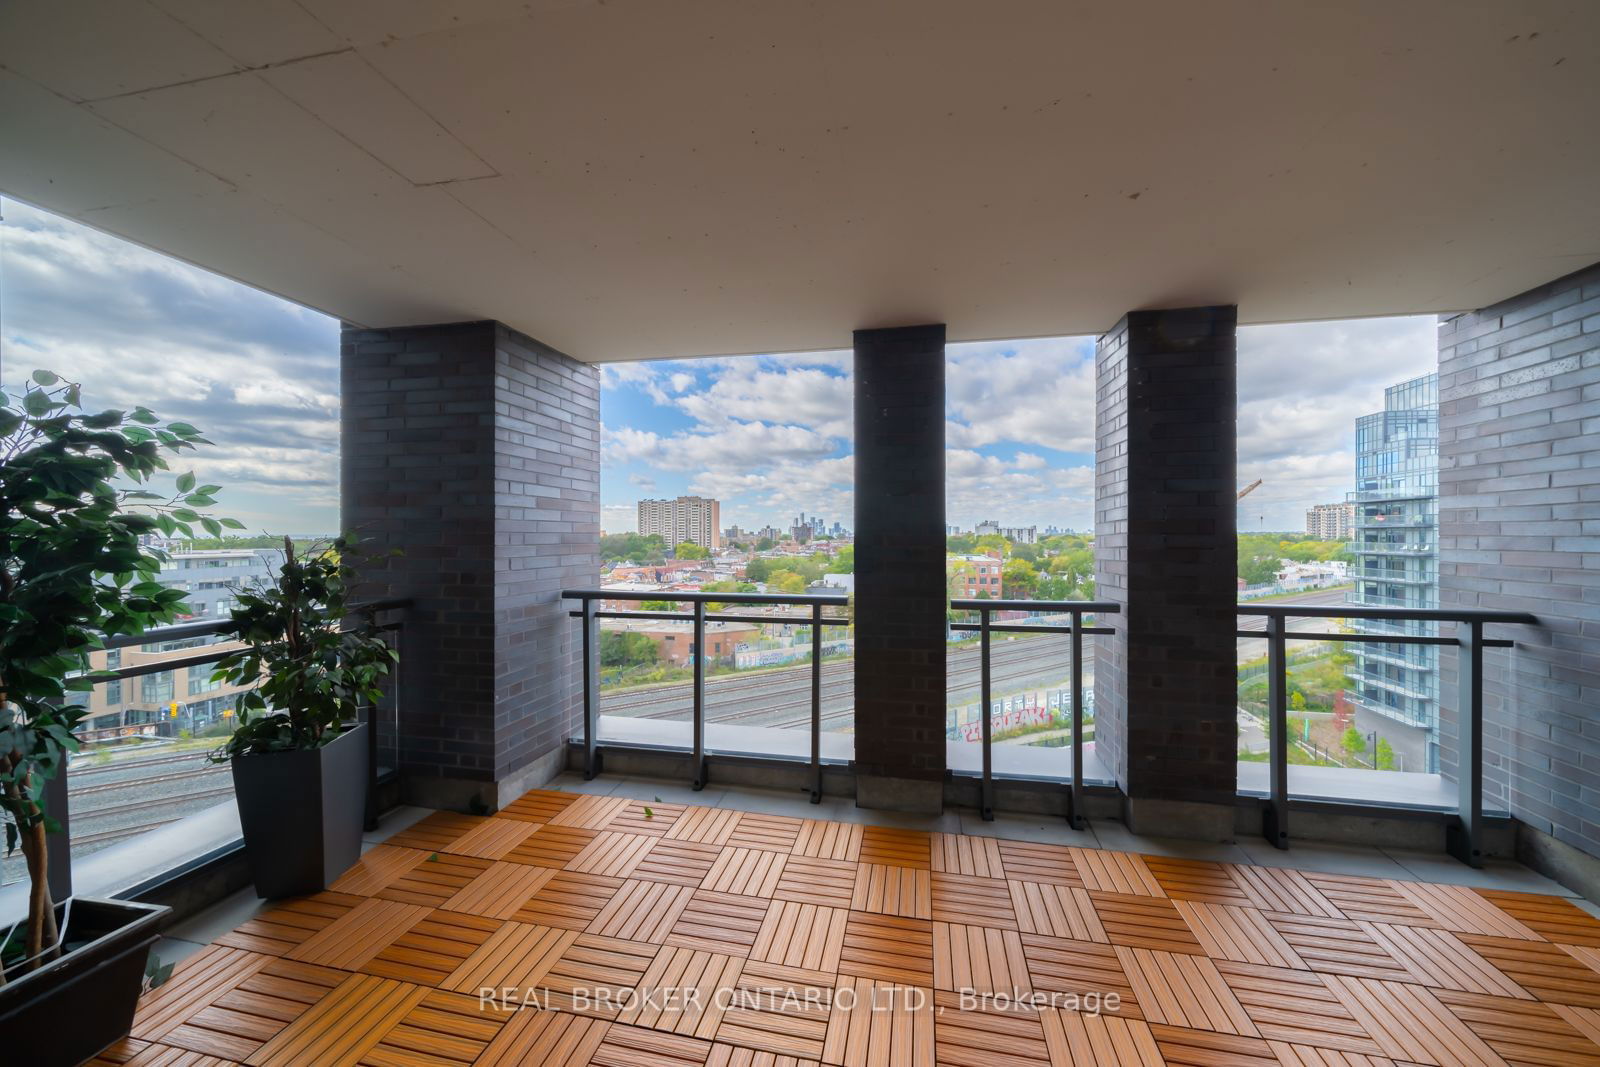
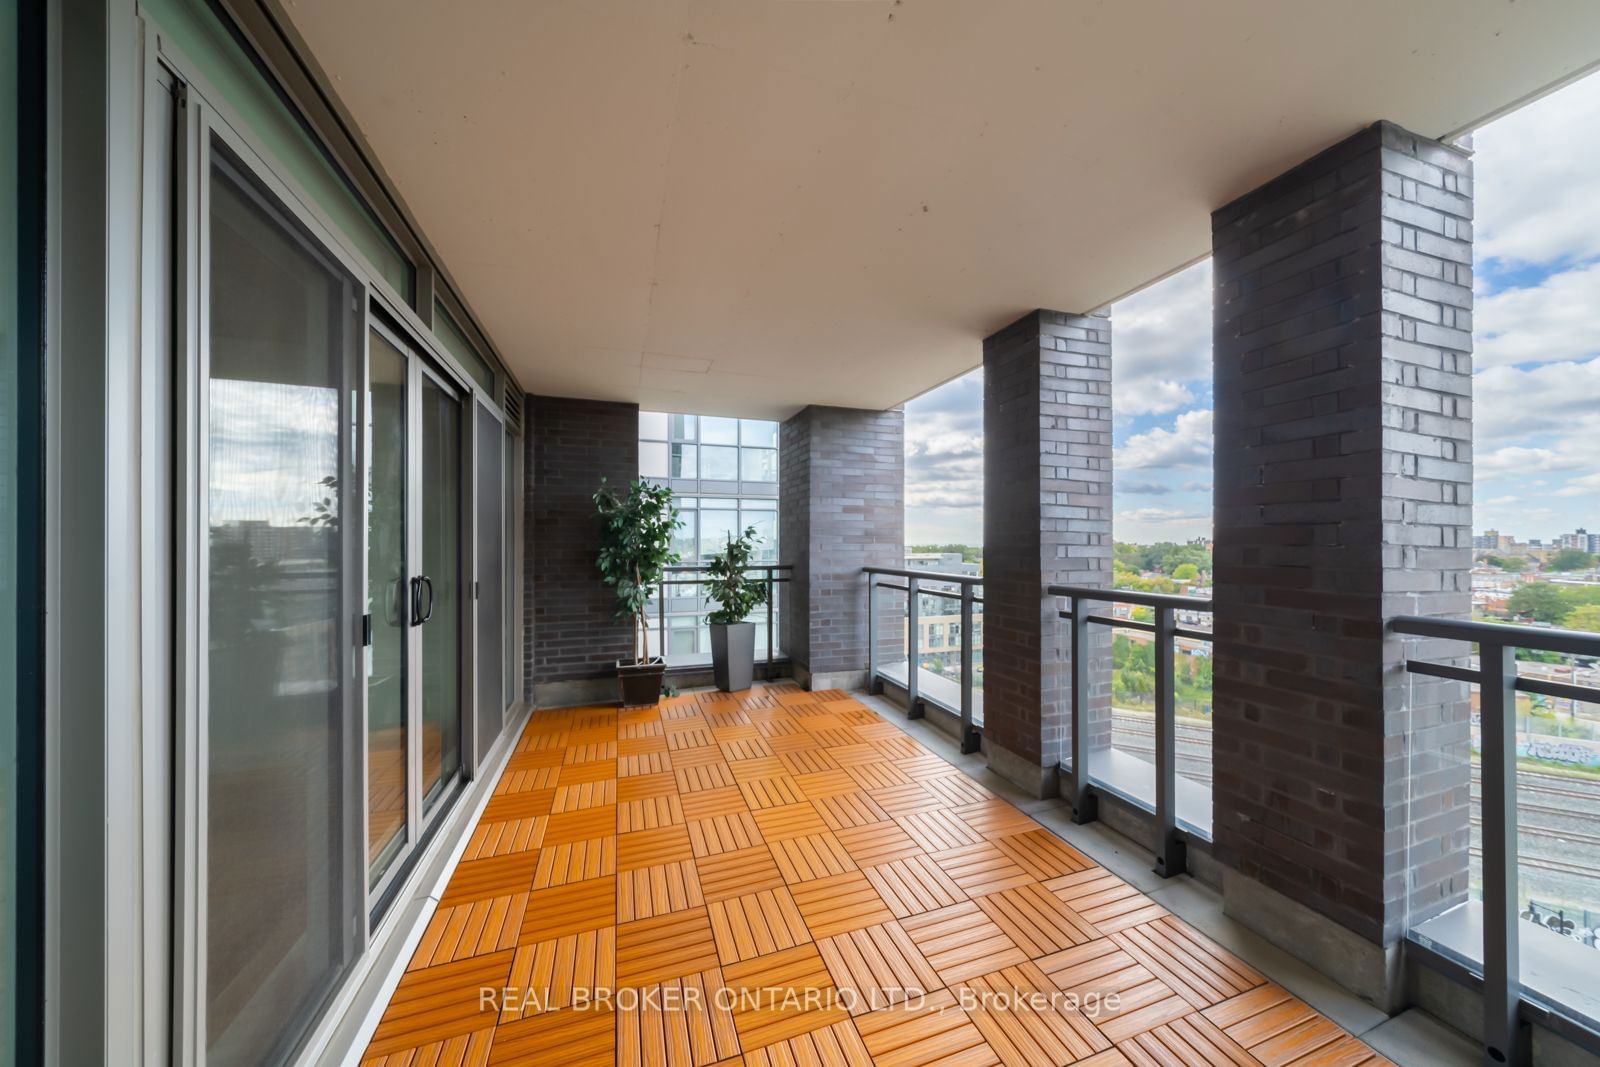
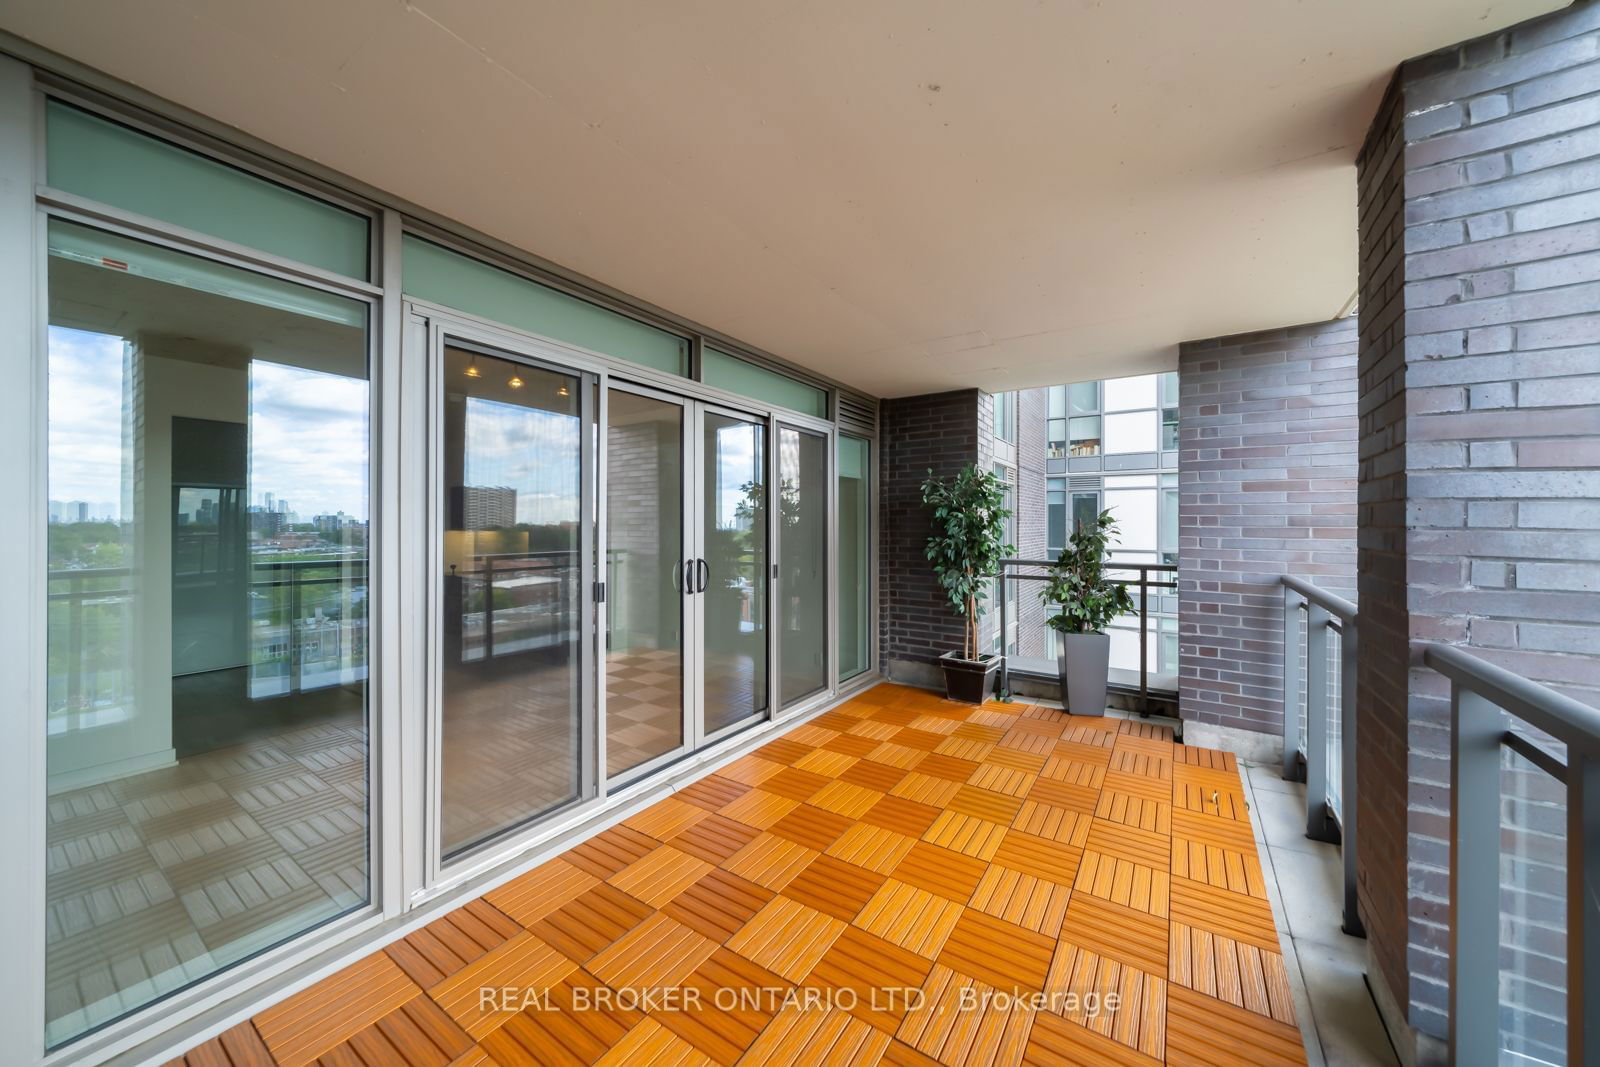
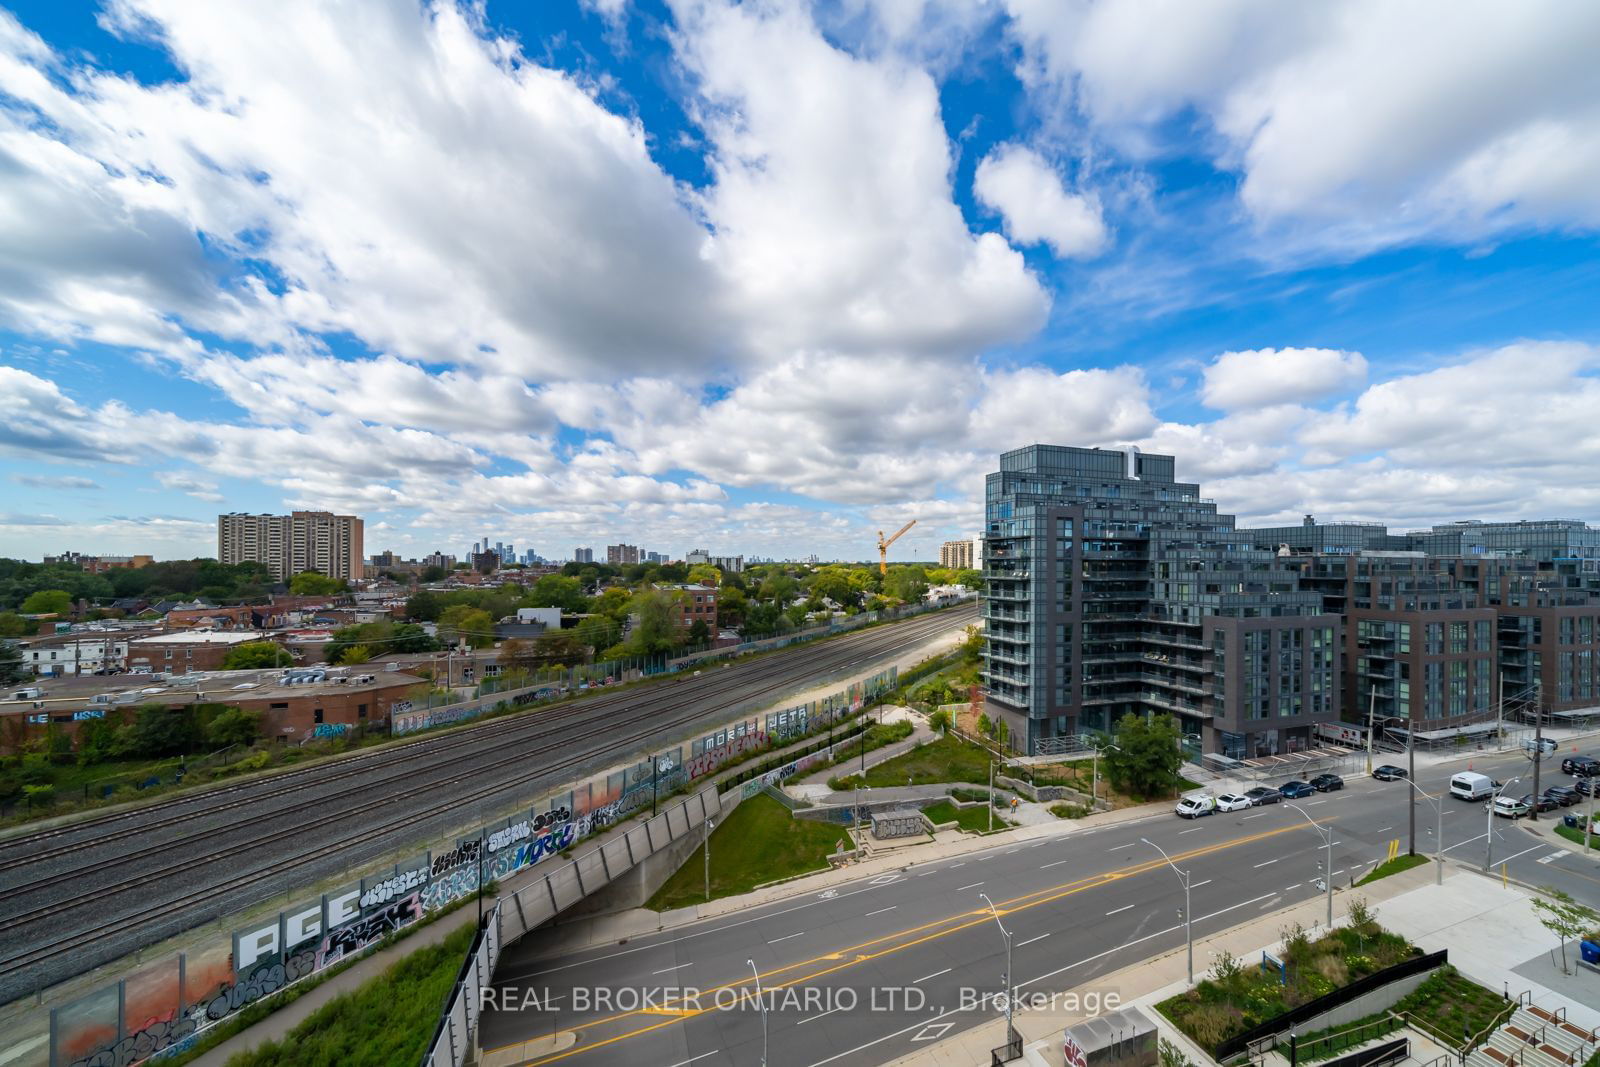
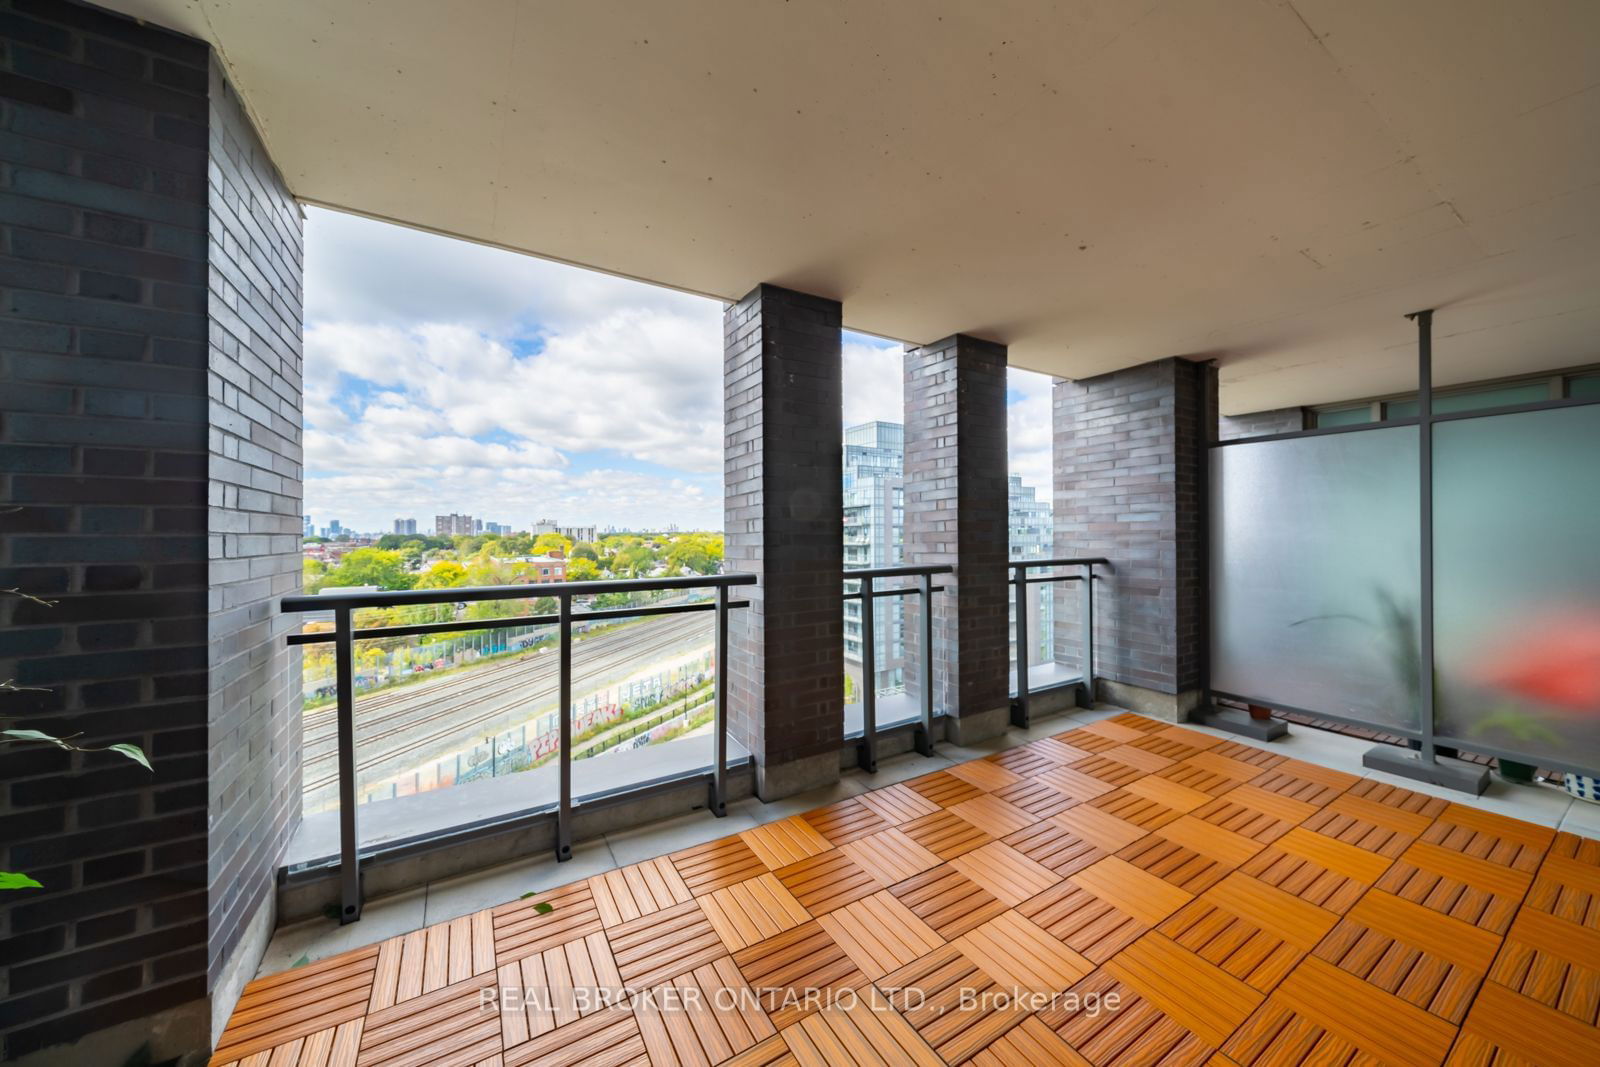
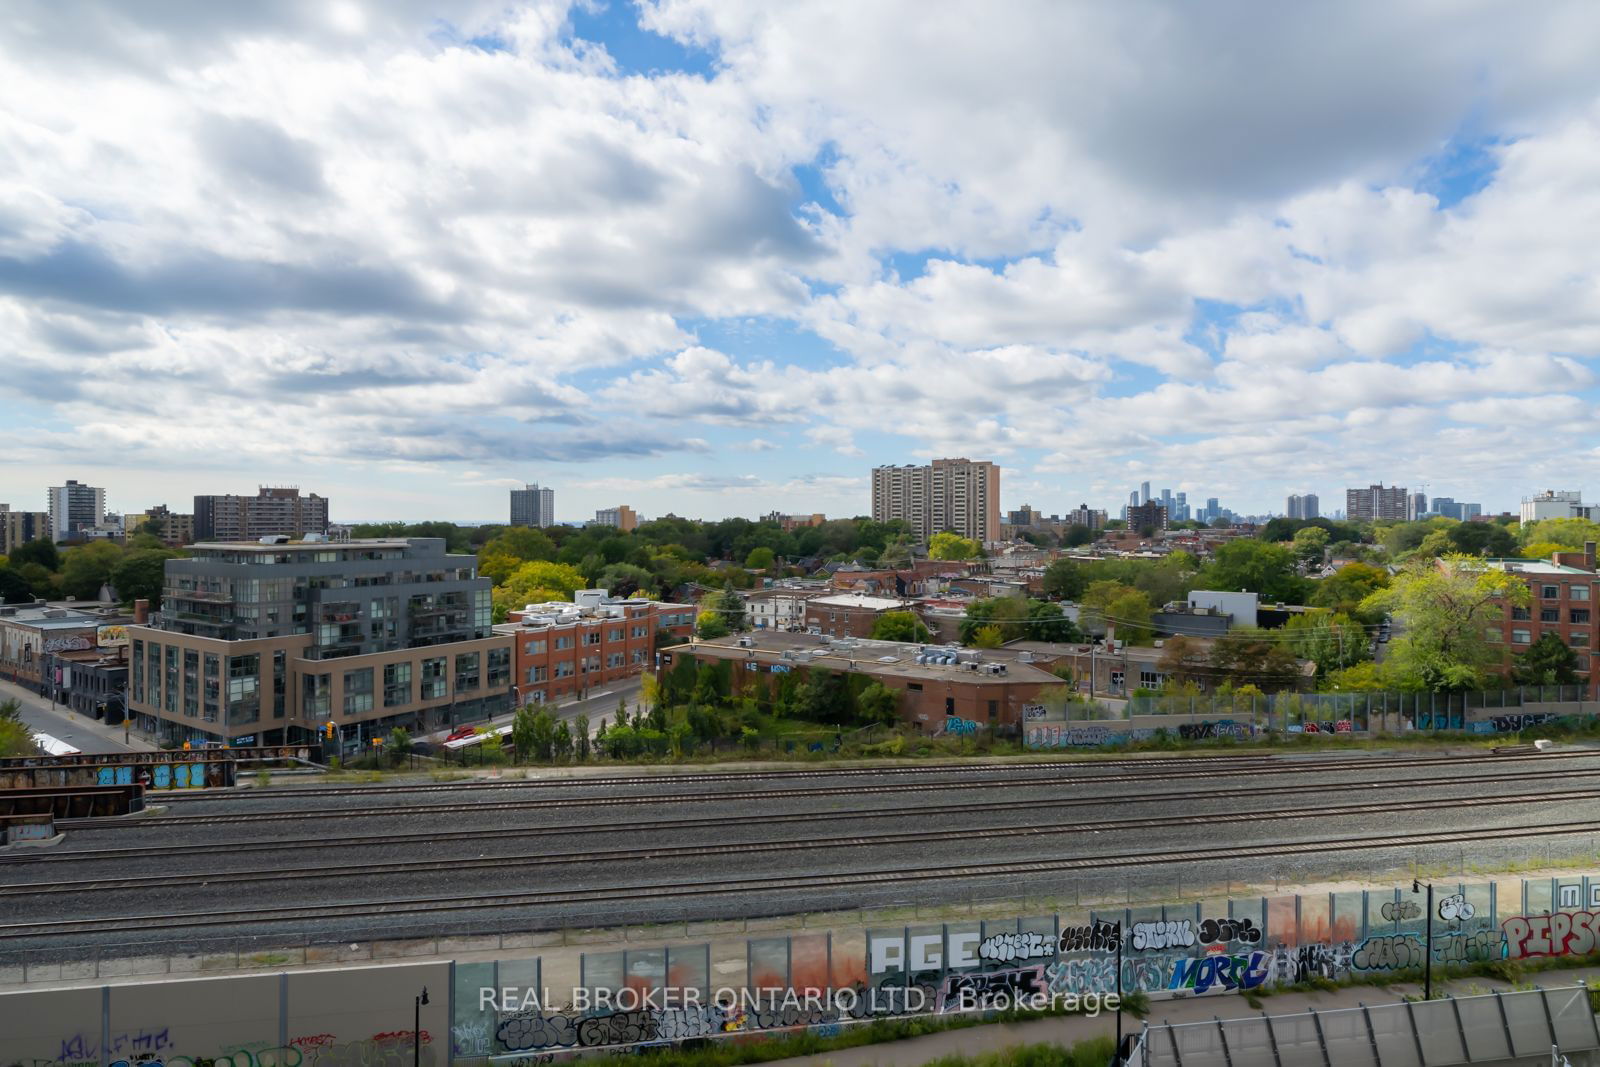
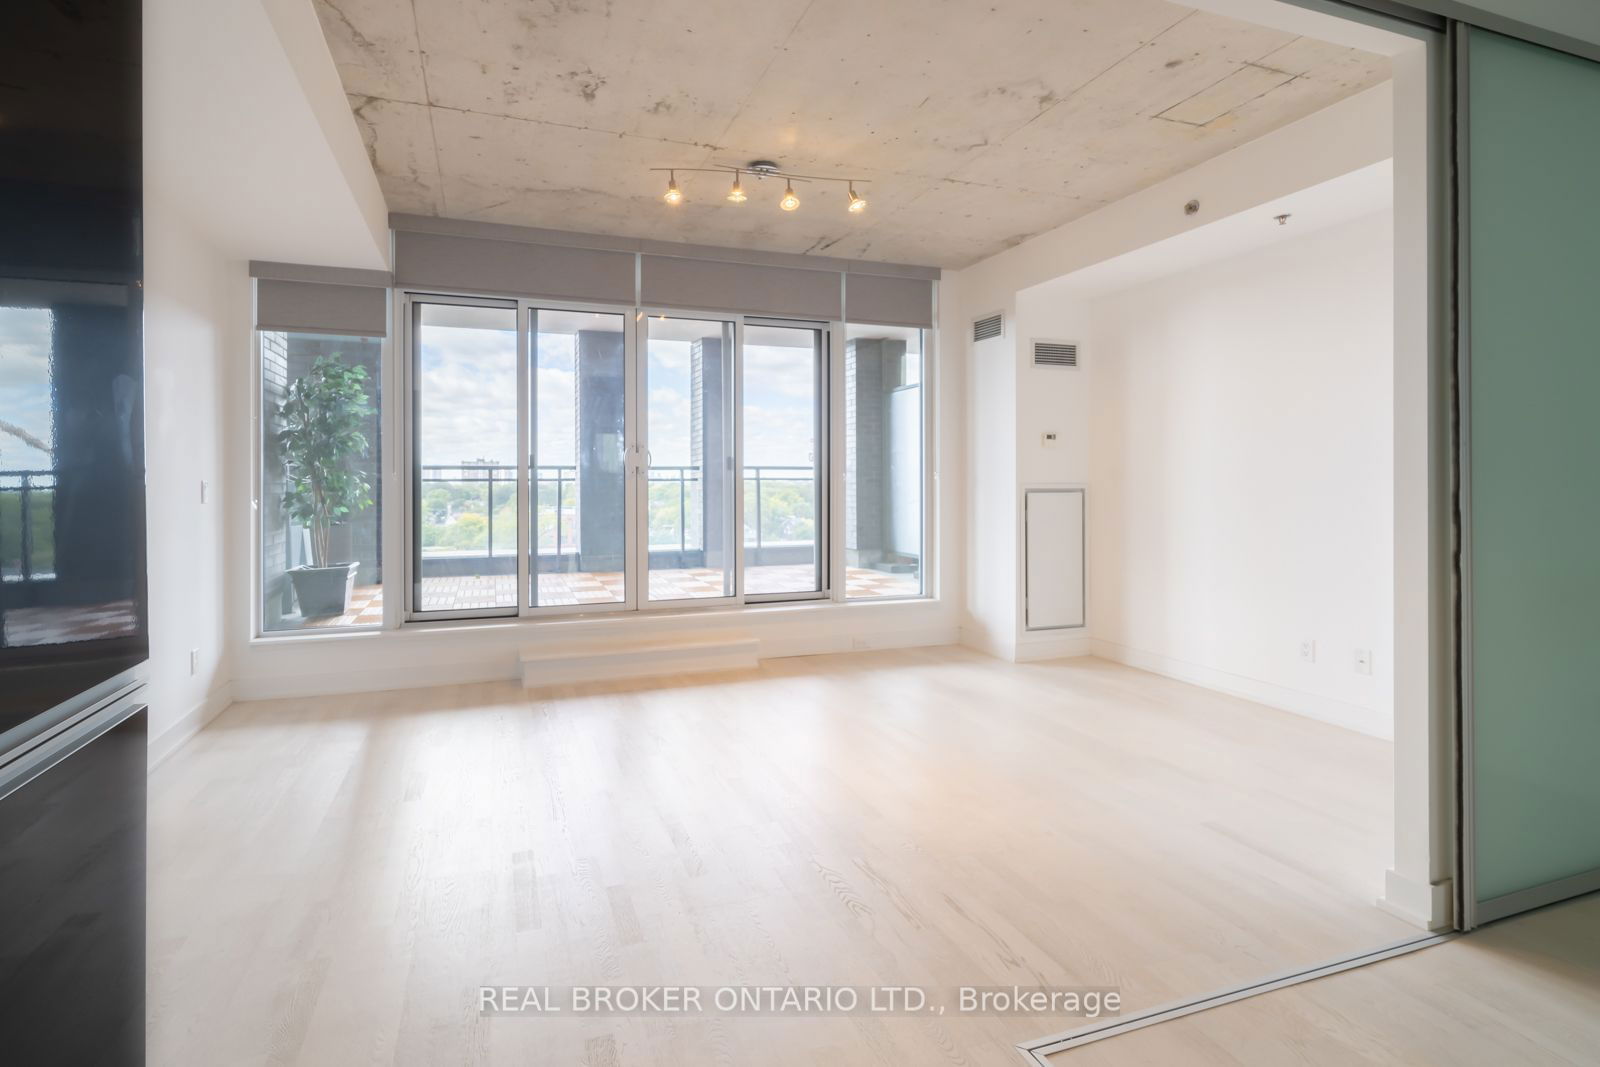
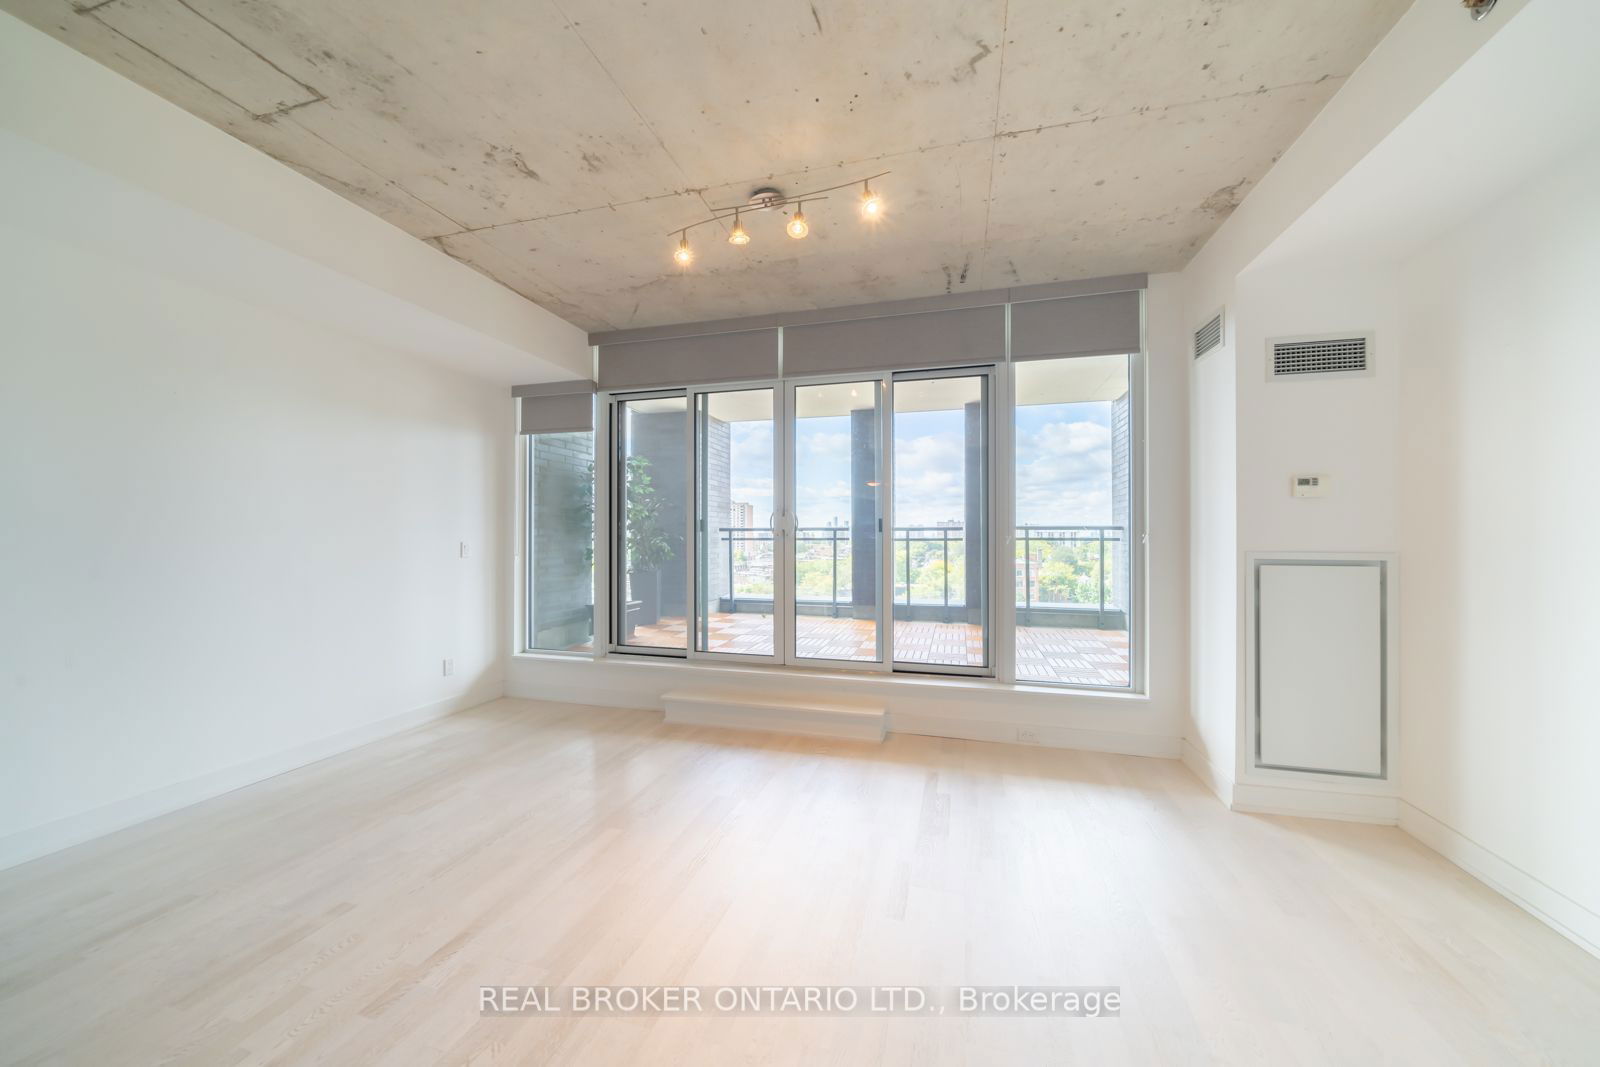
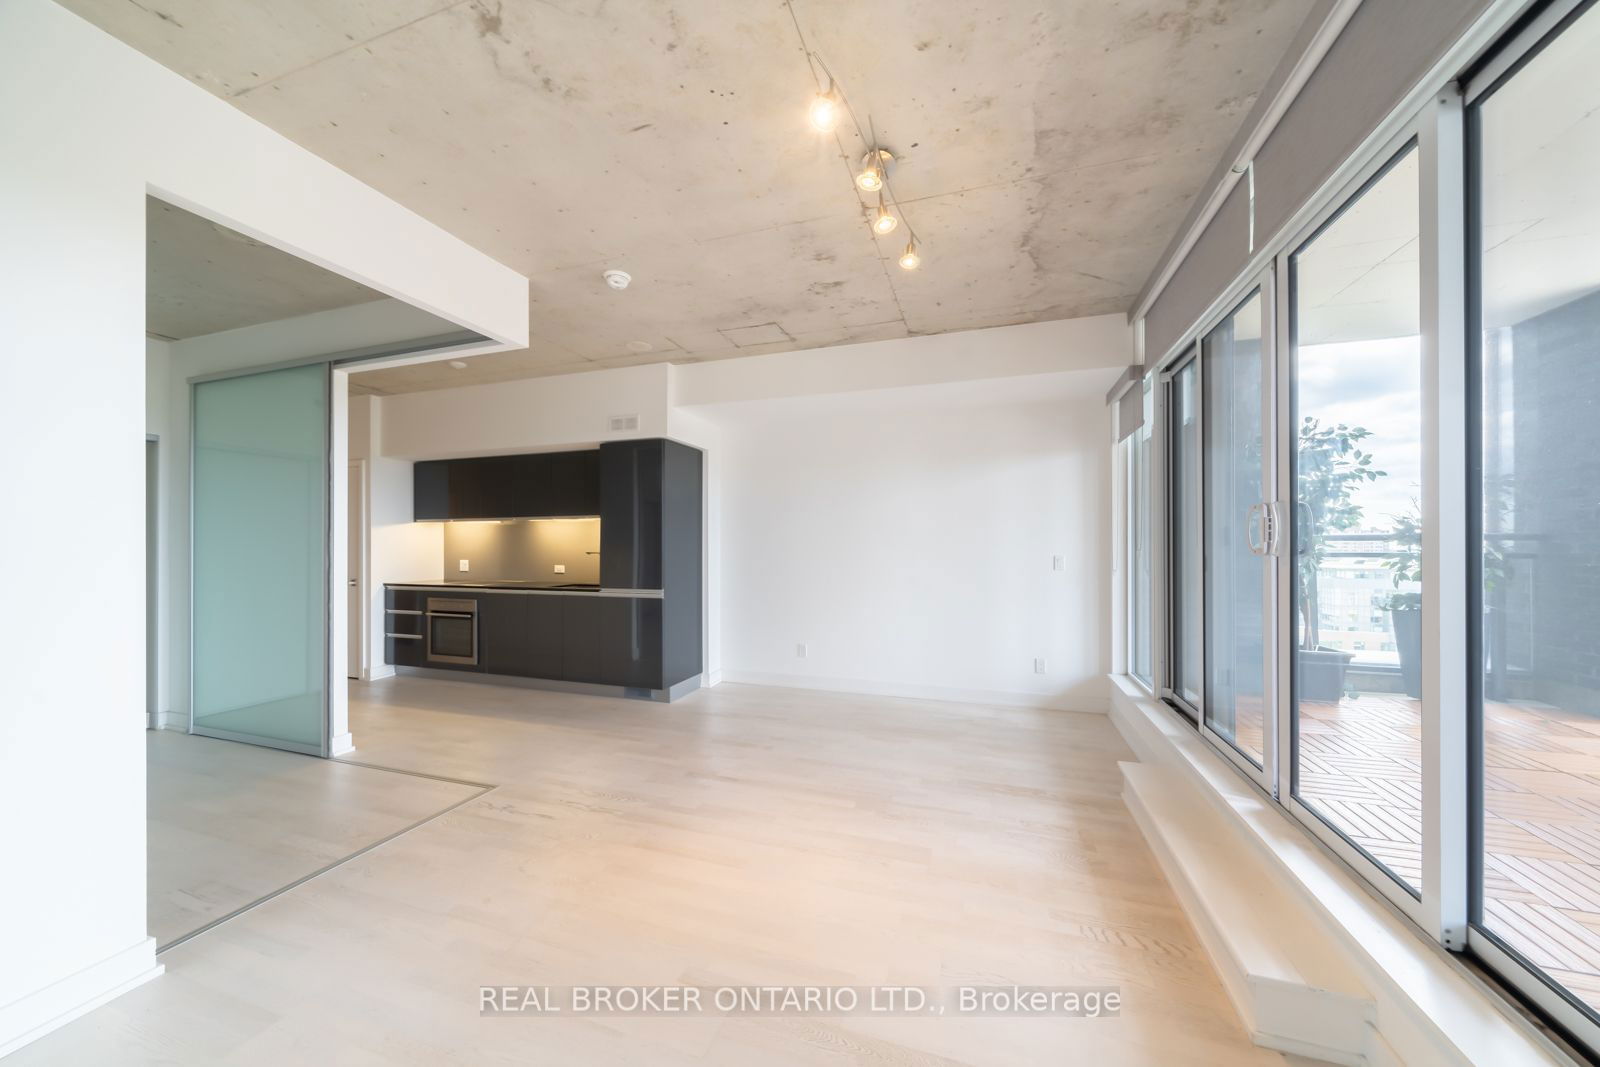
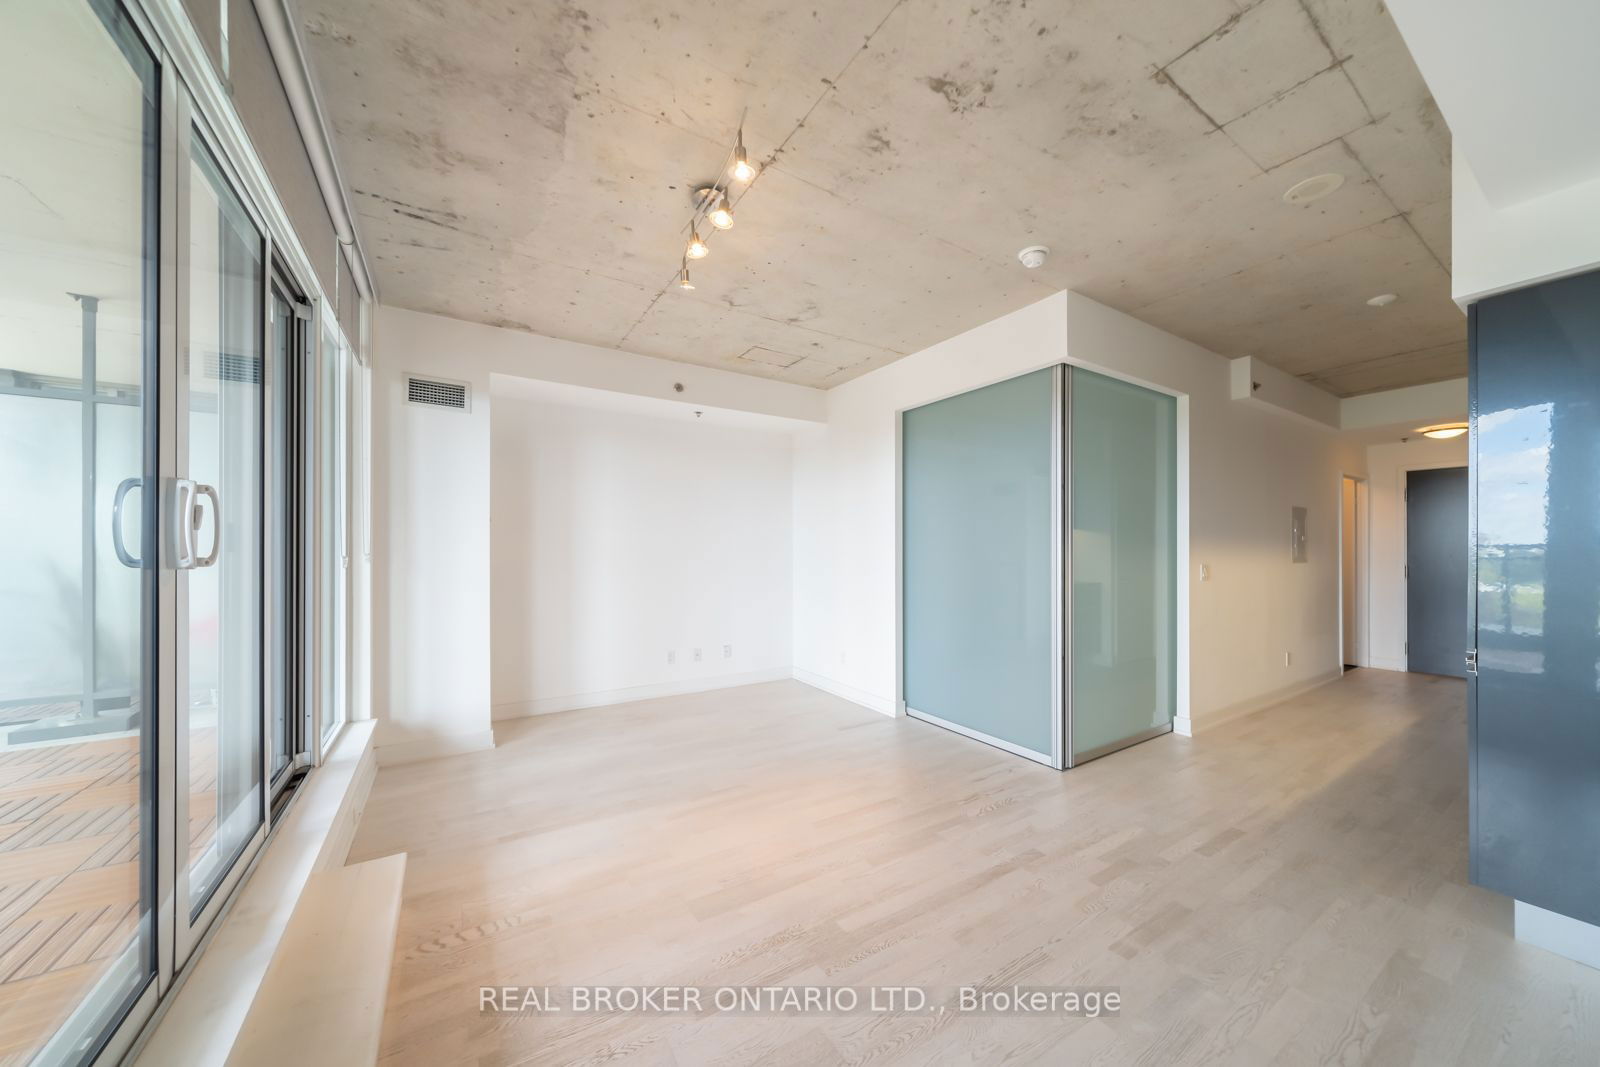
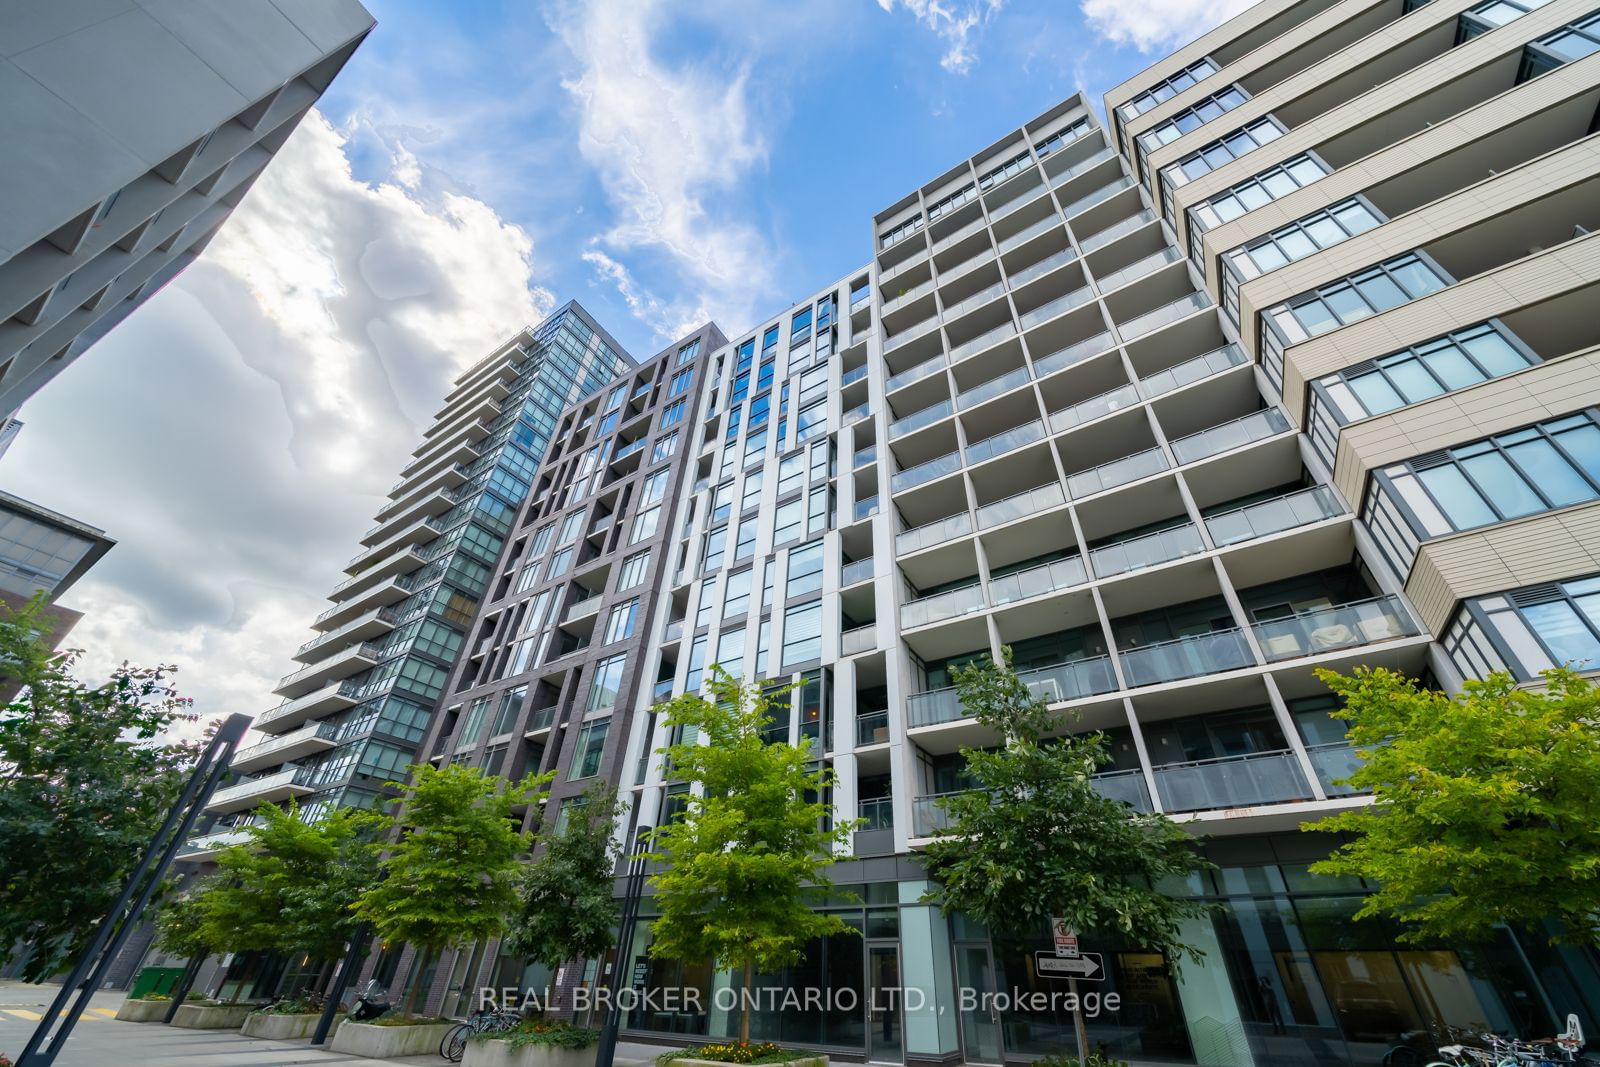
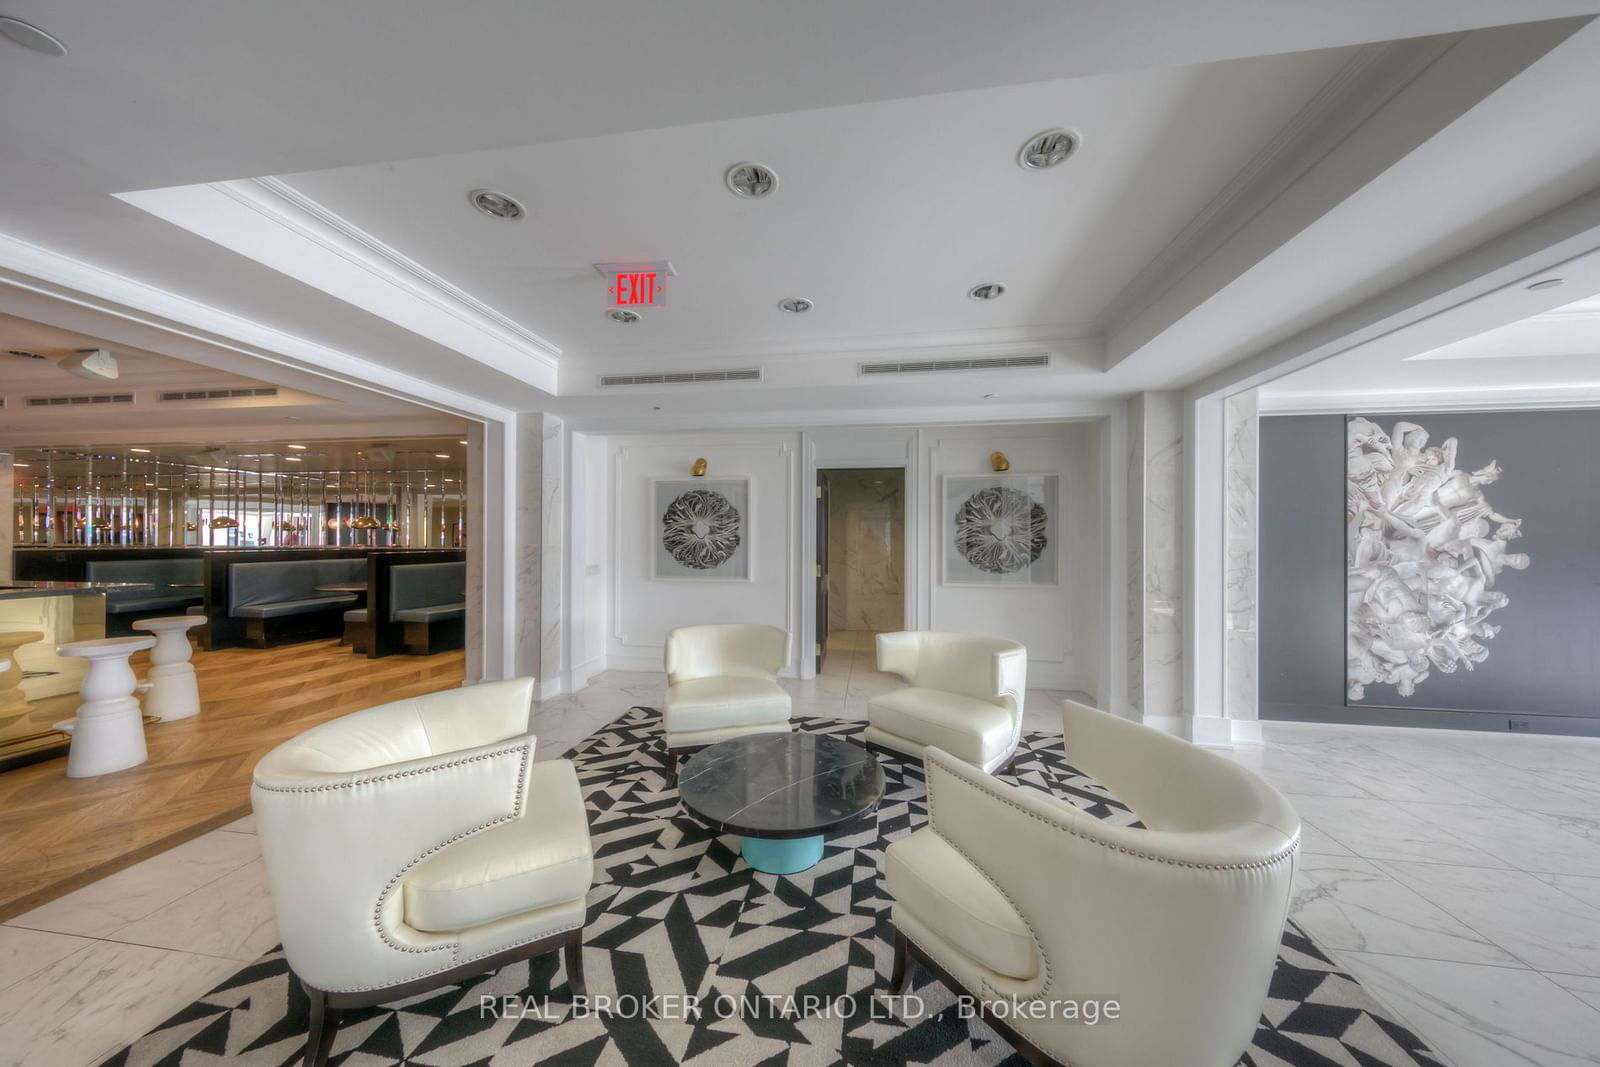
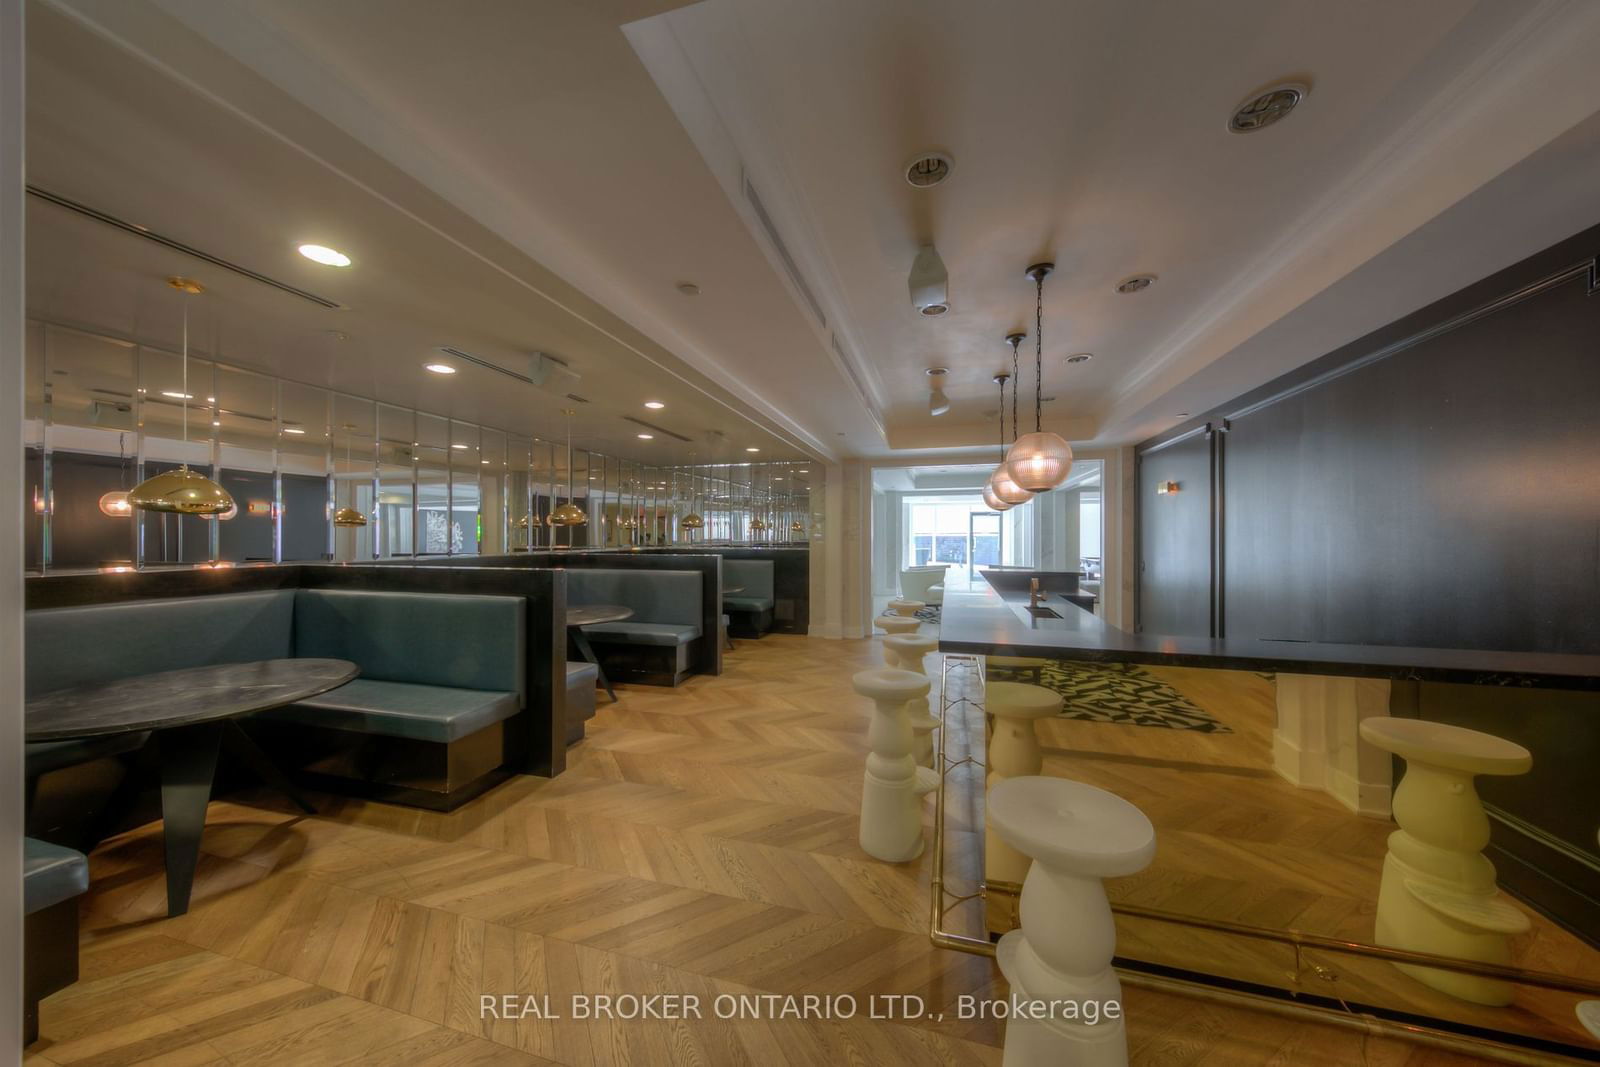
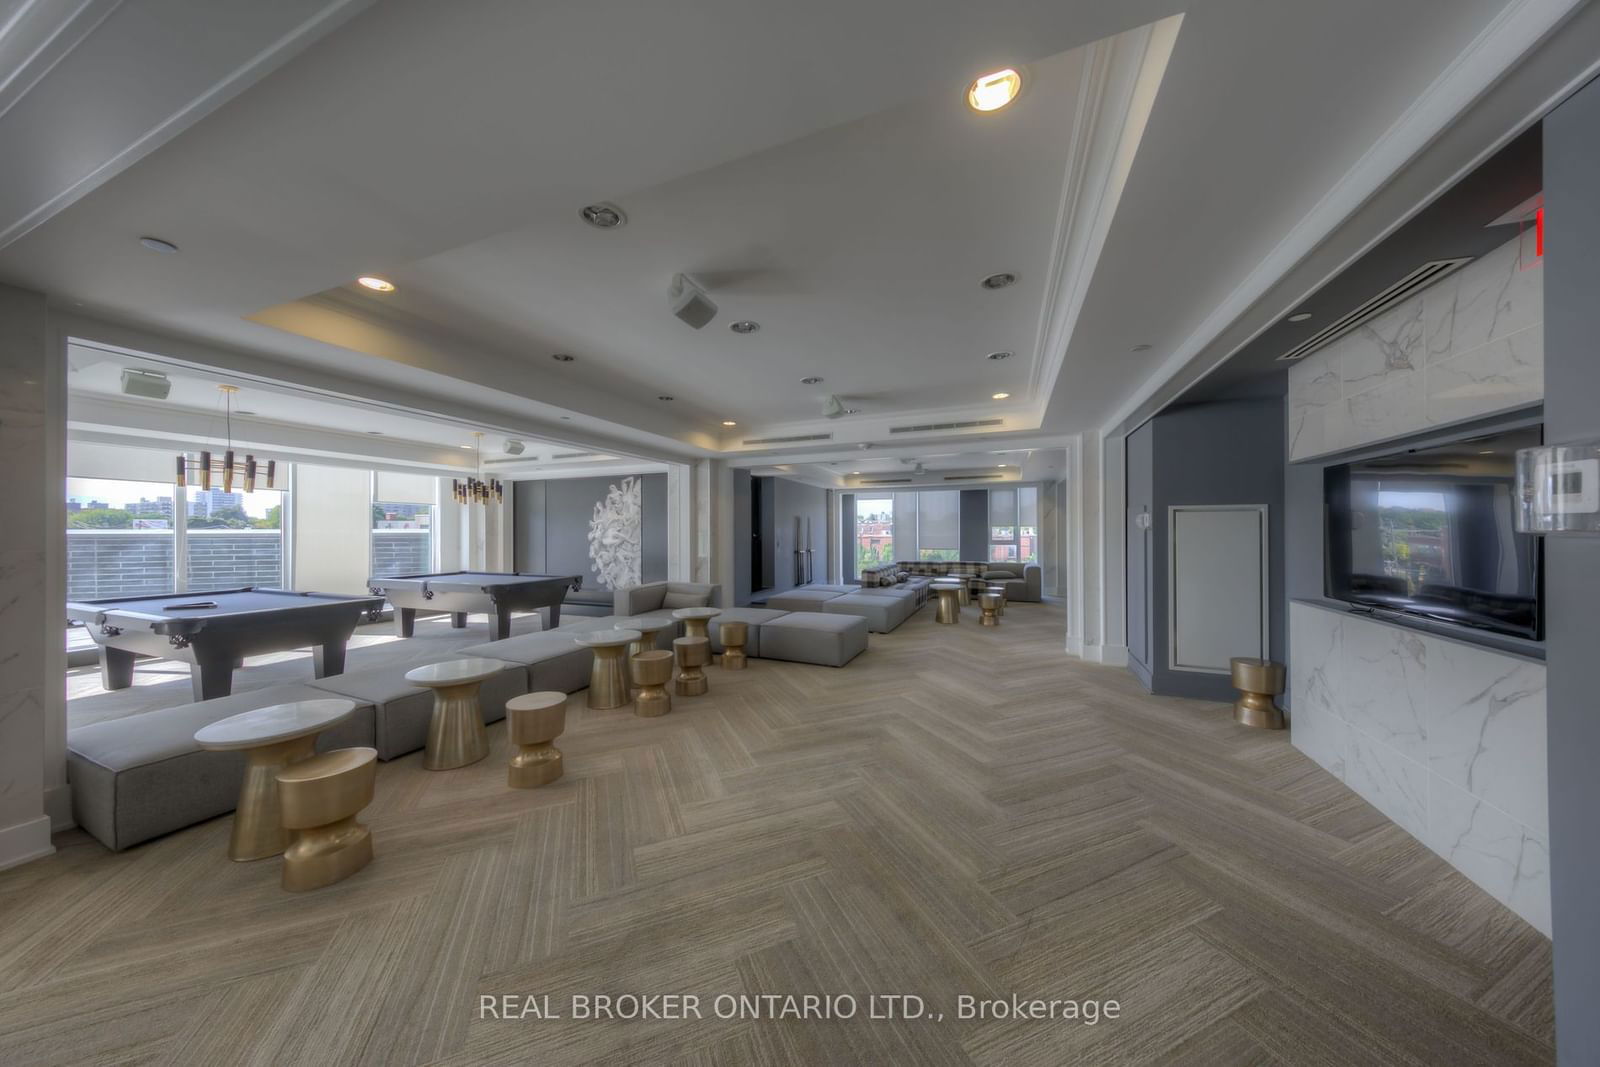
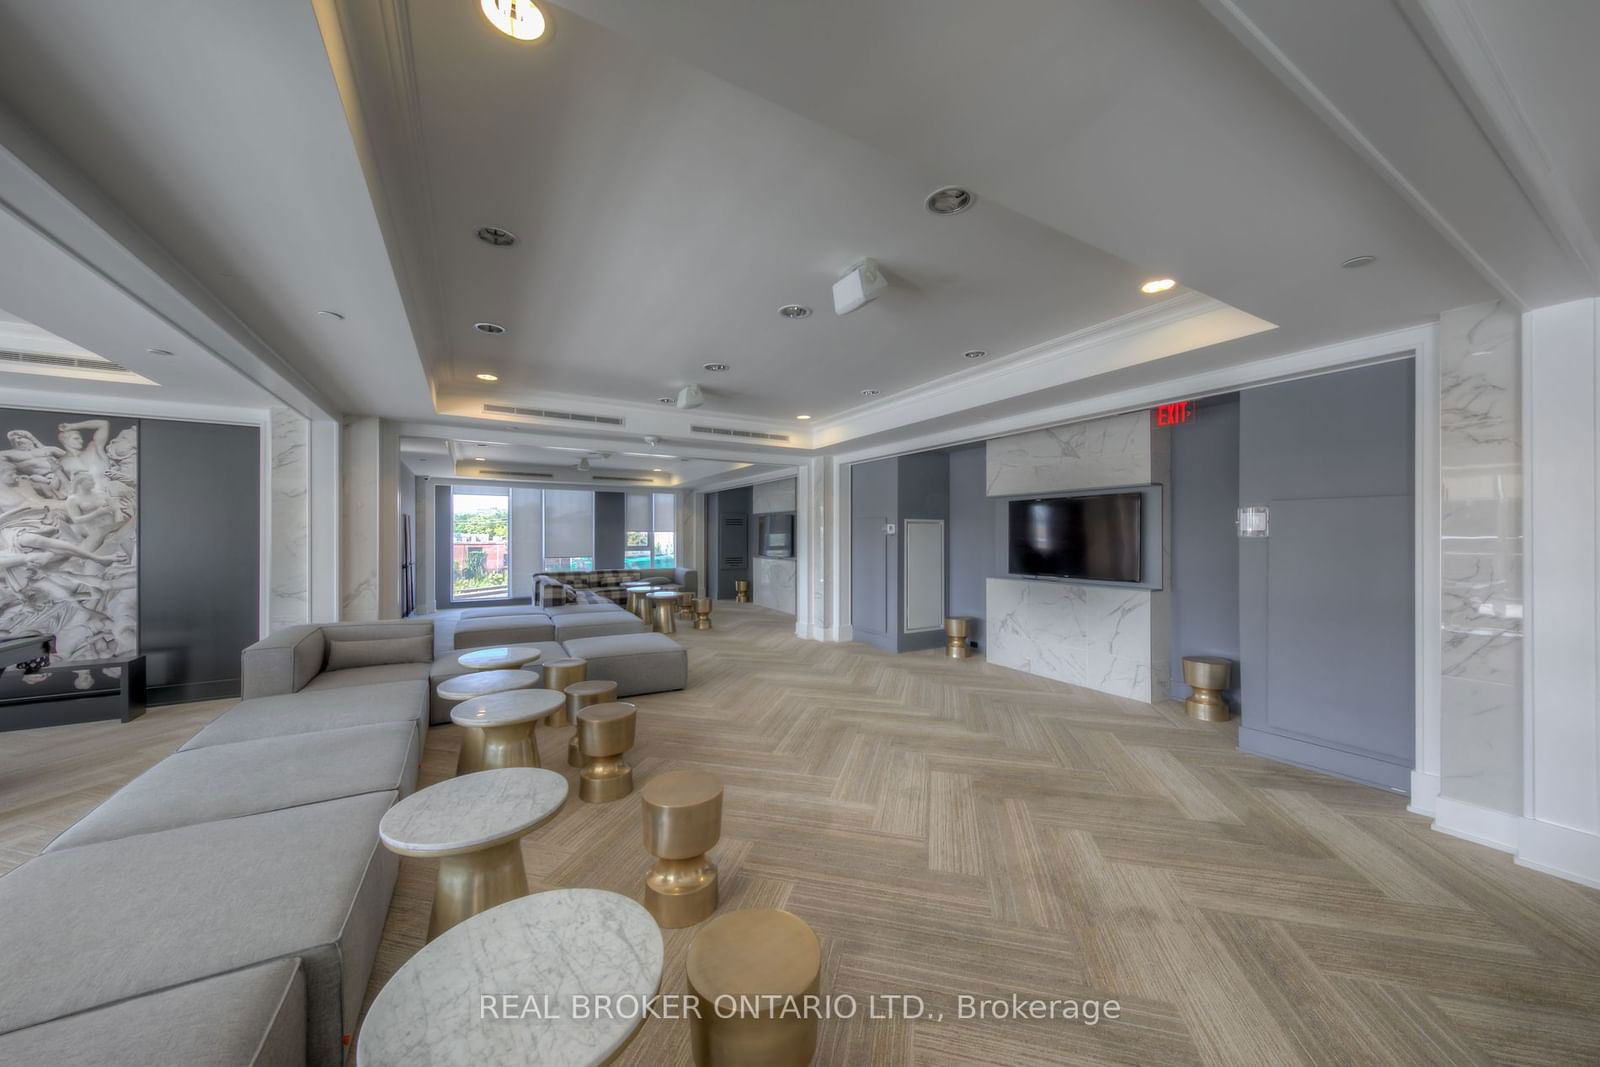
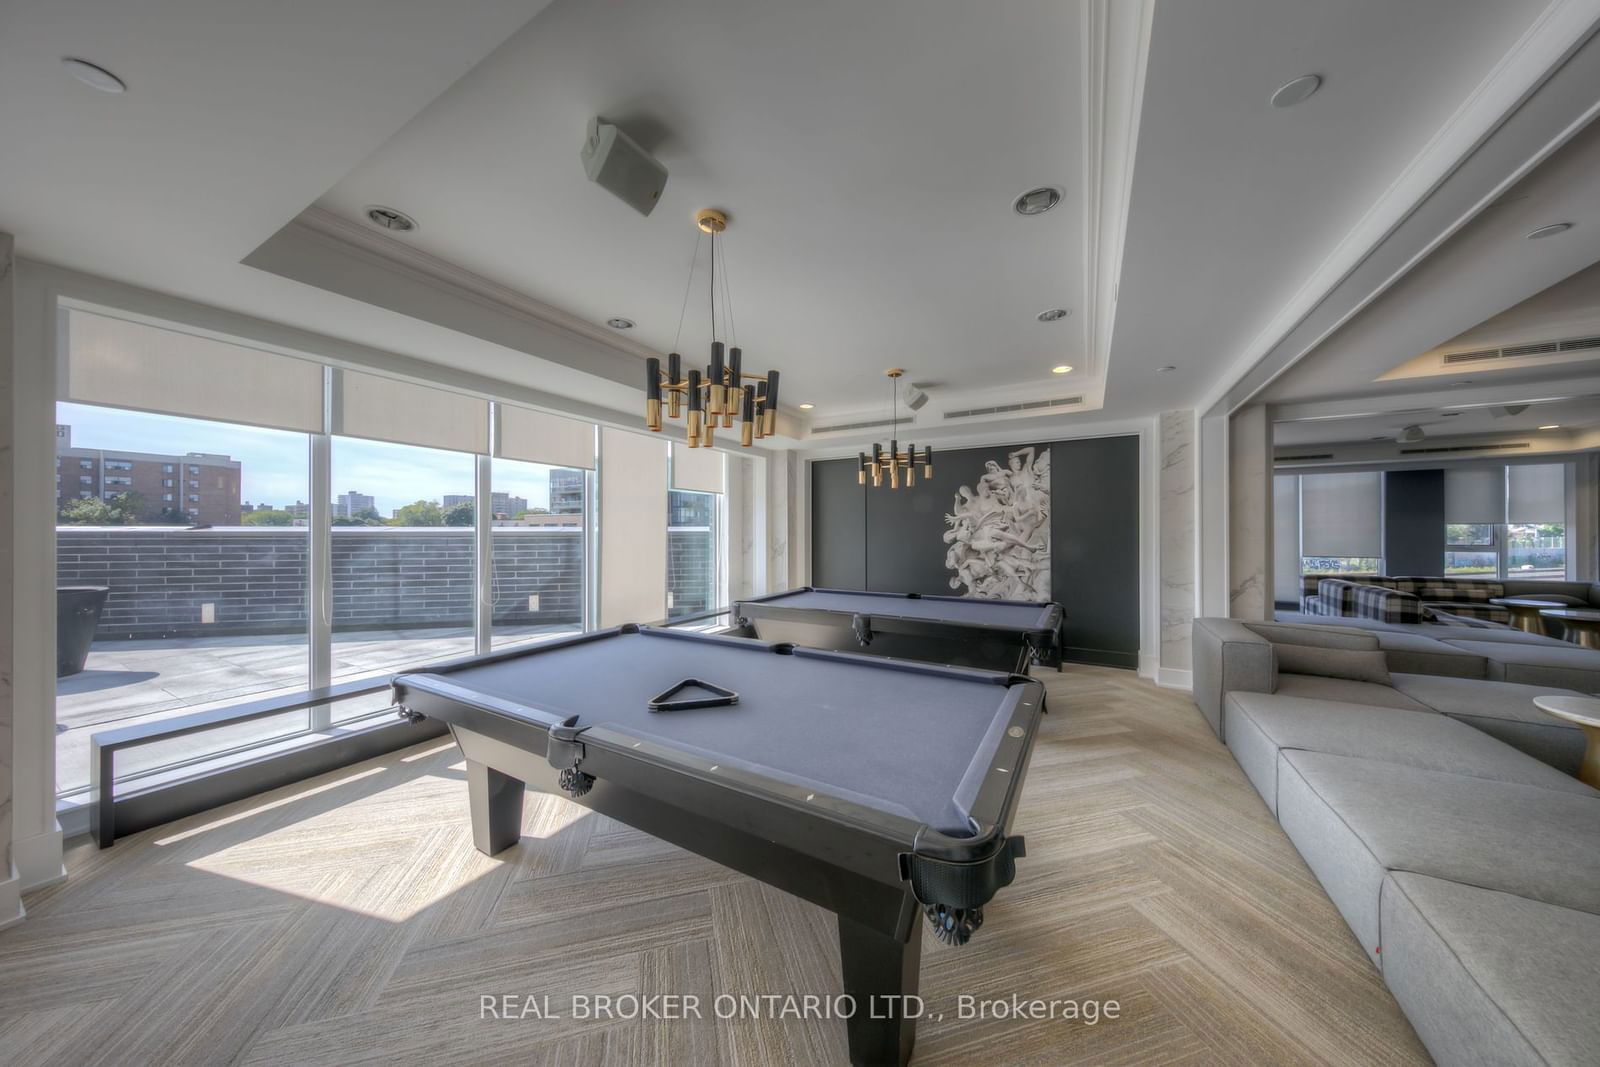
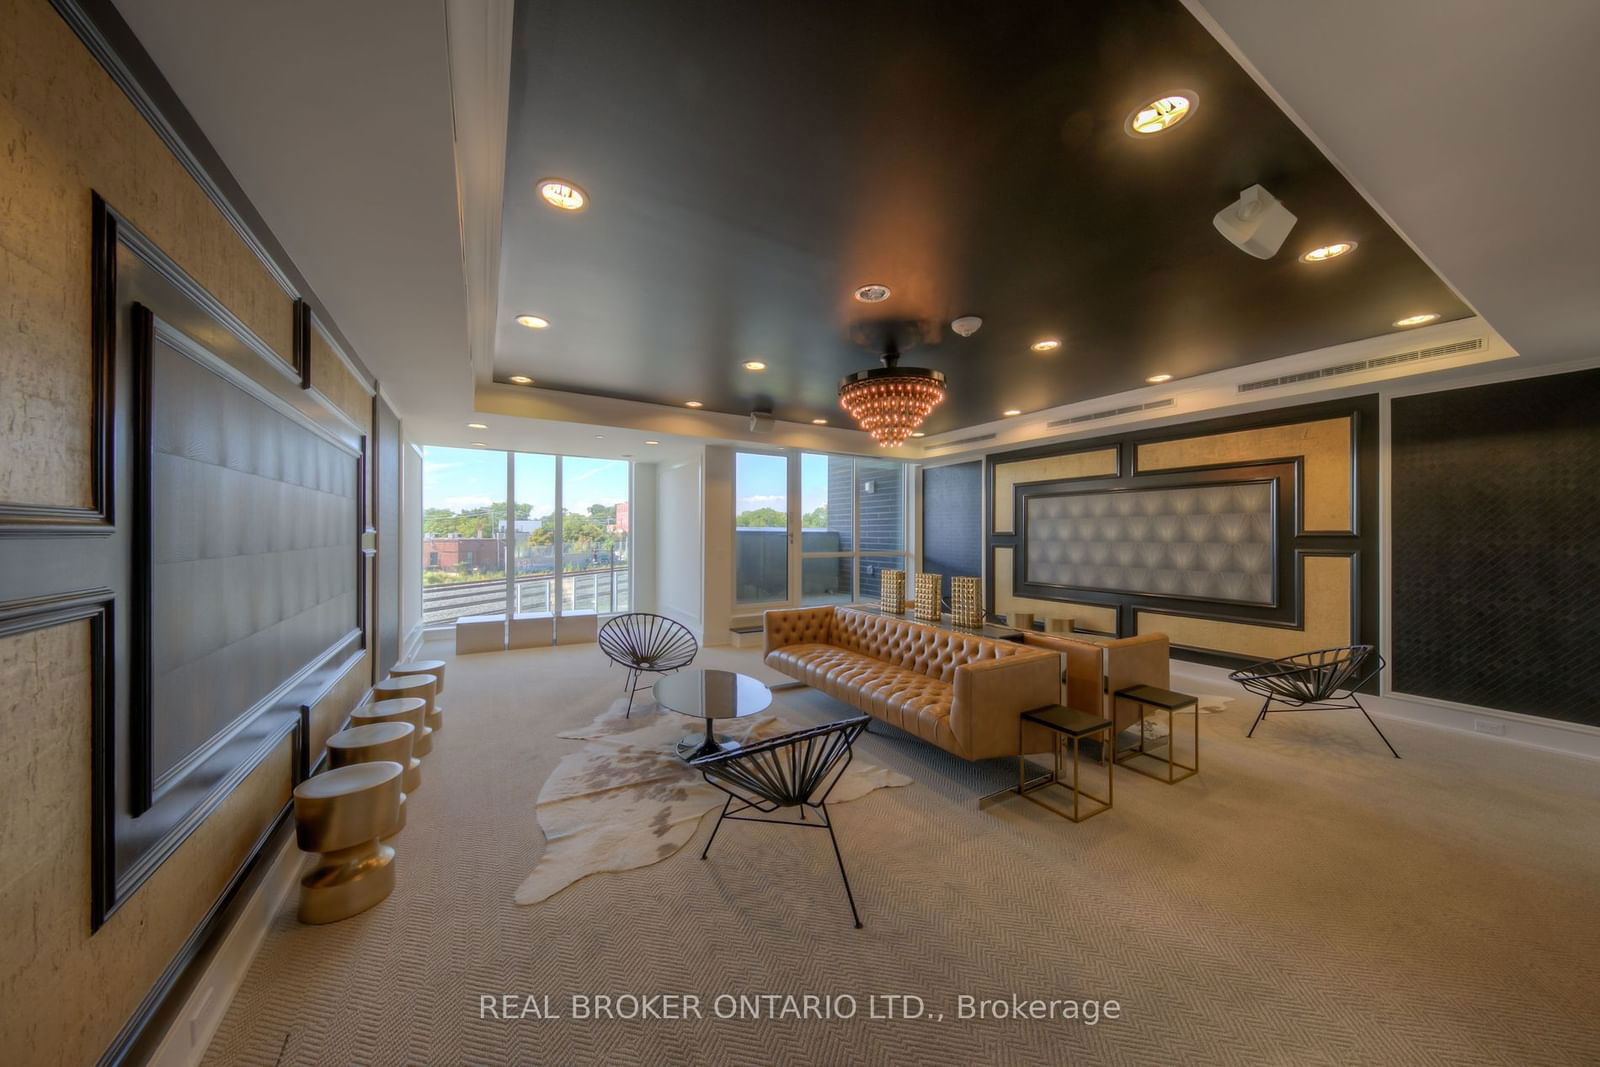
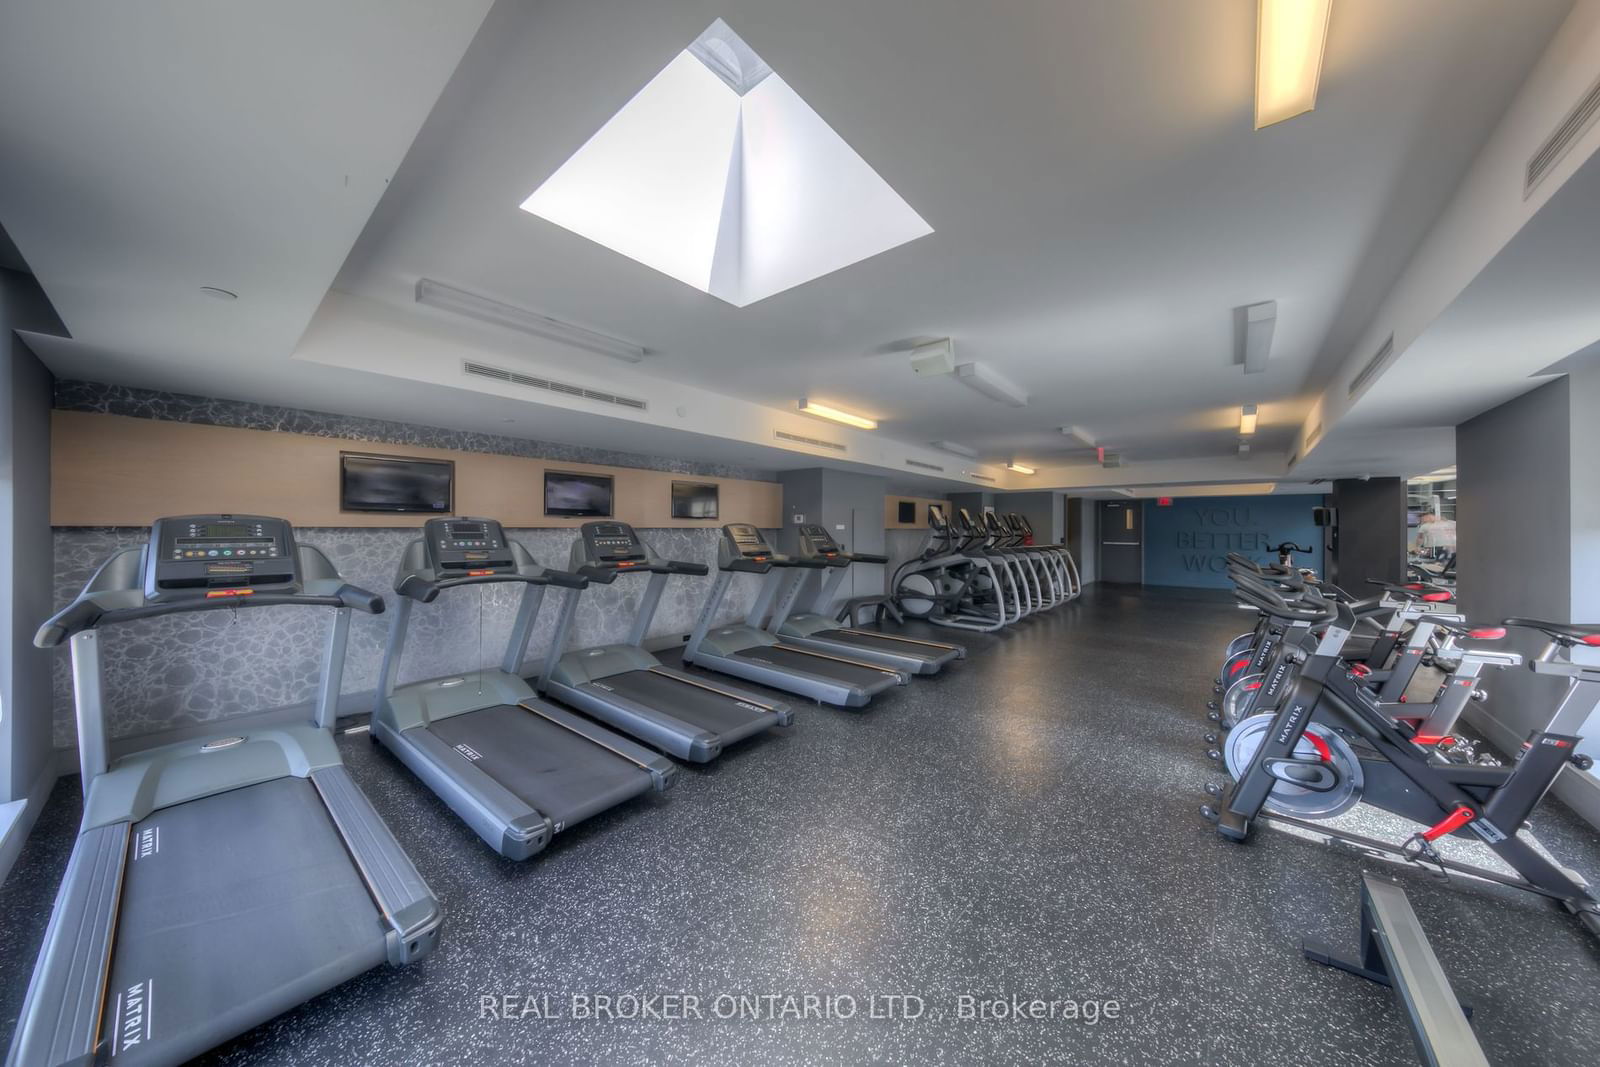
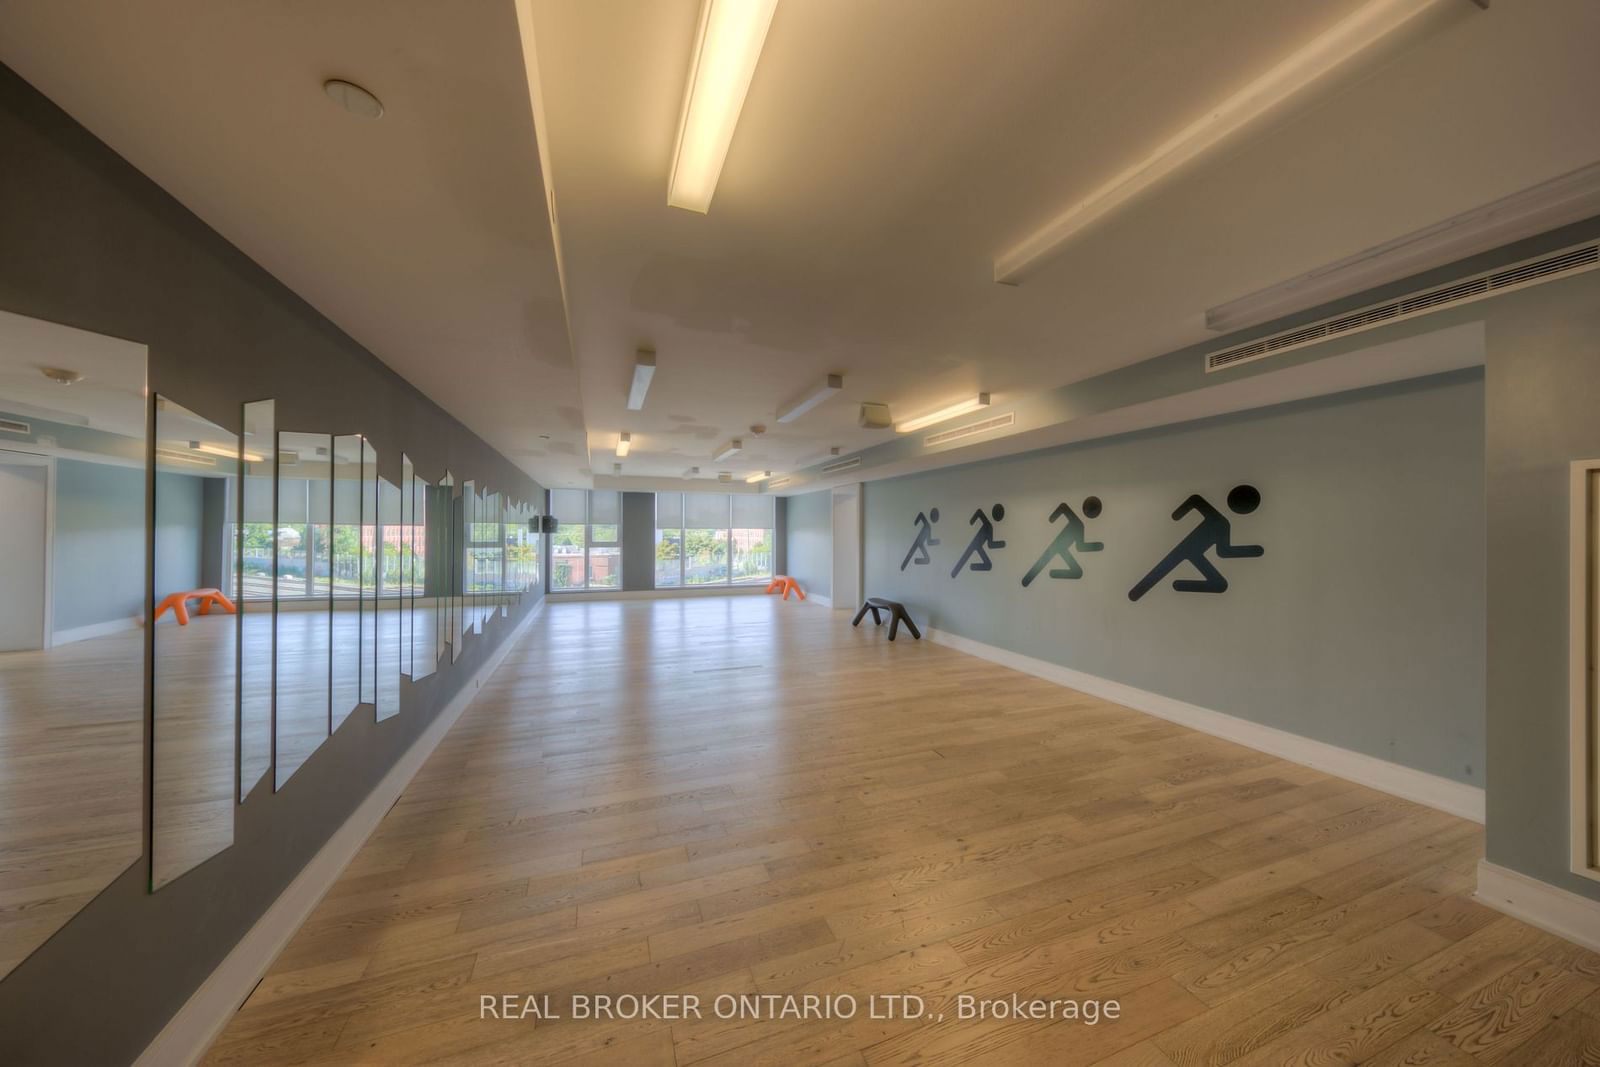
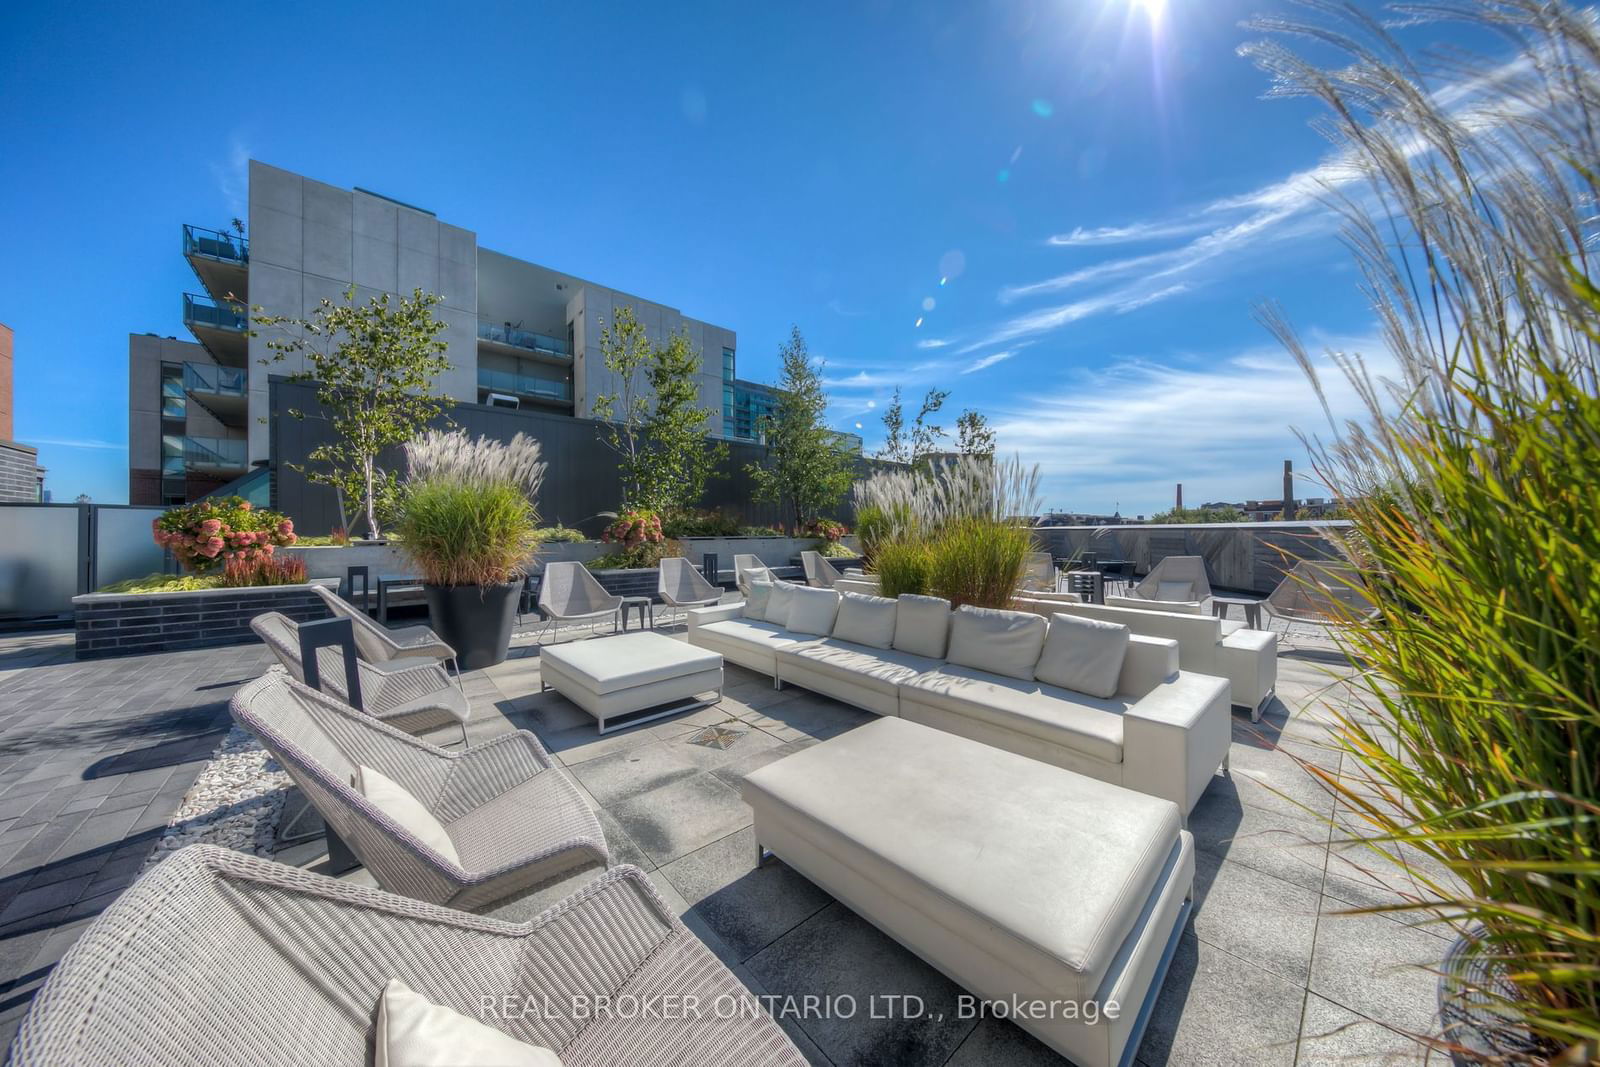
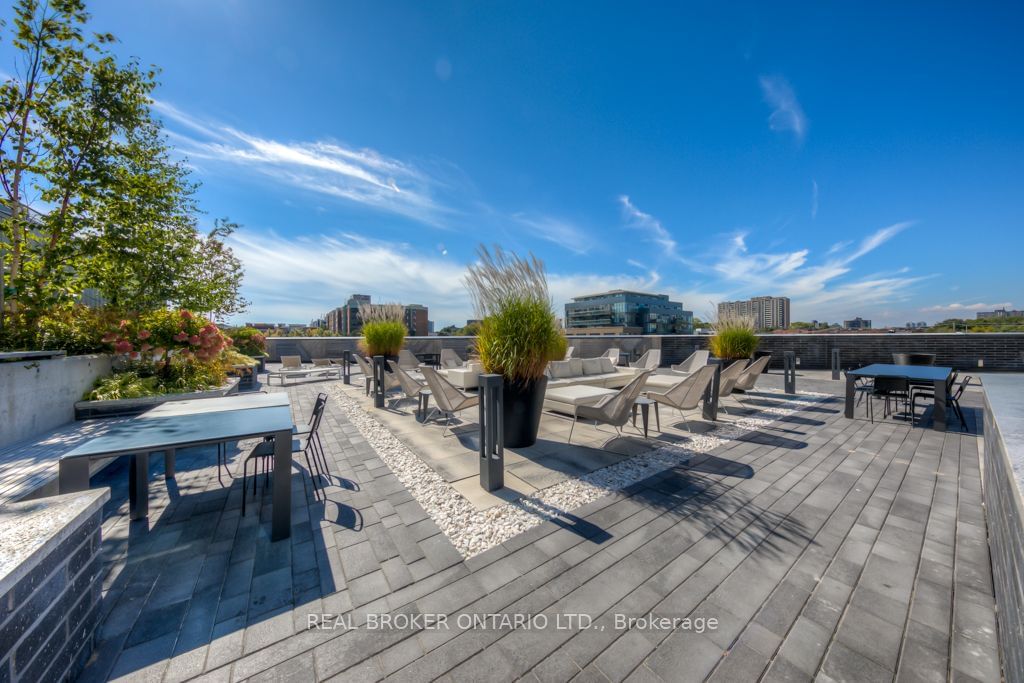
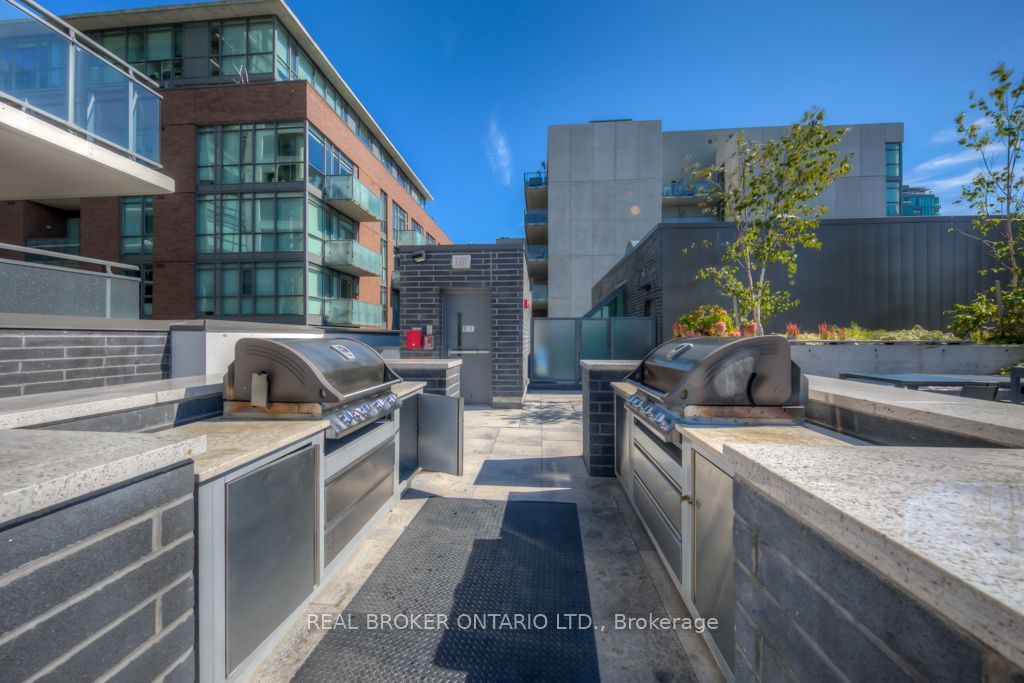
Welcome To West Queen West One of the coolest neighbourhoods in the world - An art & Design District. This Superb soft loft - 1 Bedroom Features 9' Concrete Ceilings, Engineered Wood Floors Throughout, A Wall Of Windows, Quartz Counters & Backsplash. Huge 155 Sft. covered Balcony Featuring Gorgeous Sunsets All Year Round and covered from the elements. Great Shopping, Dining, Health, Coffee shops, Bars & Entertainment. Direct Access To 24 Hr Metro. 24 Hr Streetcar. Great Amenities Incl. Gym, Huge Party Room W/Terrace, Pool tables, 24Hr Concierge and more.
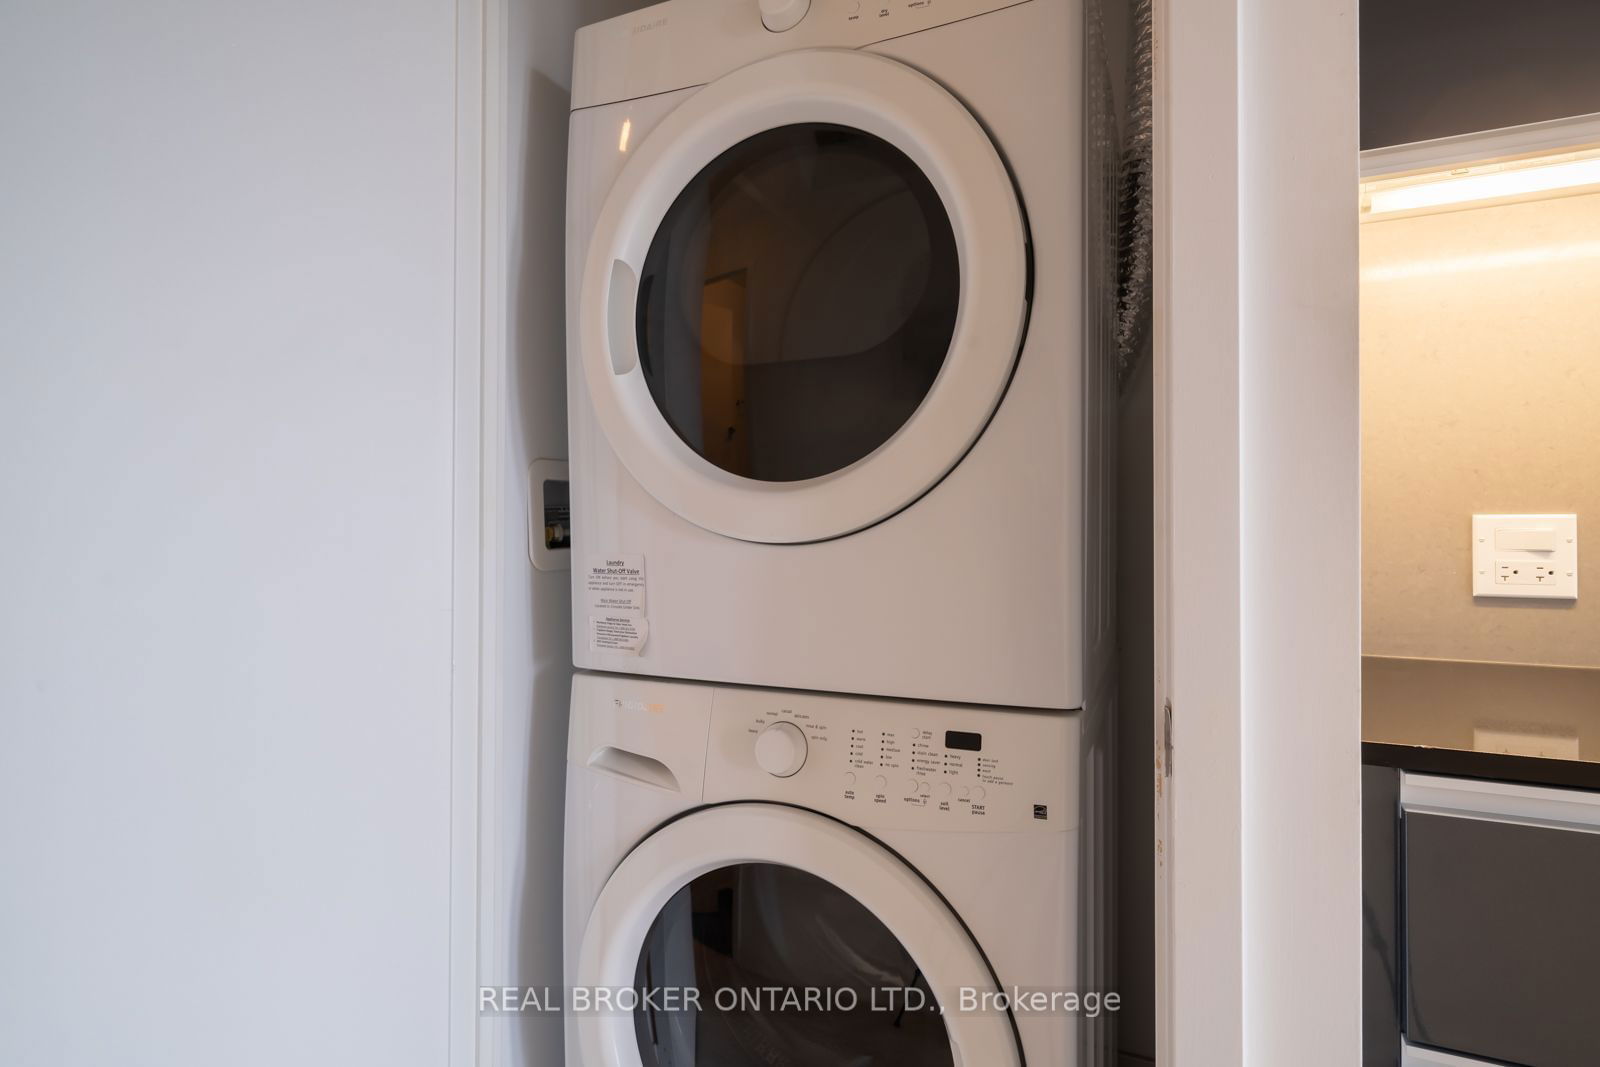
ExtrasBuilt-In Fridge & Dishwasher, Cooktop & Oven, Stacked Washer, & Dryer. All Electric Light Fixtures And Blinds.
real broker ontario ltd.MLS® #C10433123
Amenities
Explore Neighbourhood
Similar Listings
Demographics
Based on the dissemination area as defined by Statistics Canada. A dissemination area contains, on average, approximately 200 – 400 households.
Price Trends
Maintenance Fees
Building Trends At The Carnaby Condos
Days on Strata
List vs Selling Price
Or in other words, the
Offer Competition
Turnover of Units
Property Value
Price Ranking
Sold Units
Rented Units
Best Value Rank
Appreciation Rank
Rental Yield
High Demand
Transaction Insights at 20 Minowan Miikan Lane
| Studio | 1 Bed | 1 Bed + Den | 2 Bed | 2 Bed + Den | 3 Bed | 3 Bed + Den | |
|---|---|---|---|---|---|---|---|
| Price Range | No Data | $515,000 - $545,000 | $665,000 | $665,000 - $785,000 | $899,998 | $1,240,000 | No Data |
| Avg. Cost Per Sqft | No Data | $1,043 | $1,167 | $996 | $969 | $1,117 | No Data |
| Price Range | $1,800 | $2,200 - $2,675 | $2,500 - $2,850 | $2,850 - $3,300 | $3,200 | $5,000 | No Data |
| Avg. Wait for Unit Availability | No Data | 52 Days | 88 Days | 25 Days | 95 Days | 357 Days | 668 Days |
| Avg. Wait for Unit Availability | No Data | 15 Days | 45 Days | 11 Days | 227 Days | 435 Days | No Data |
| Ratio of Units in Building | 1% | 35% | 11% | 47% | 6% | 2% | 1% |
Transactions vs Inventory
Total number of units listed and leased in Roncesvalles

