


1 / 19
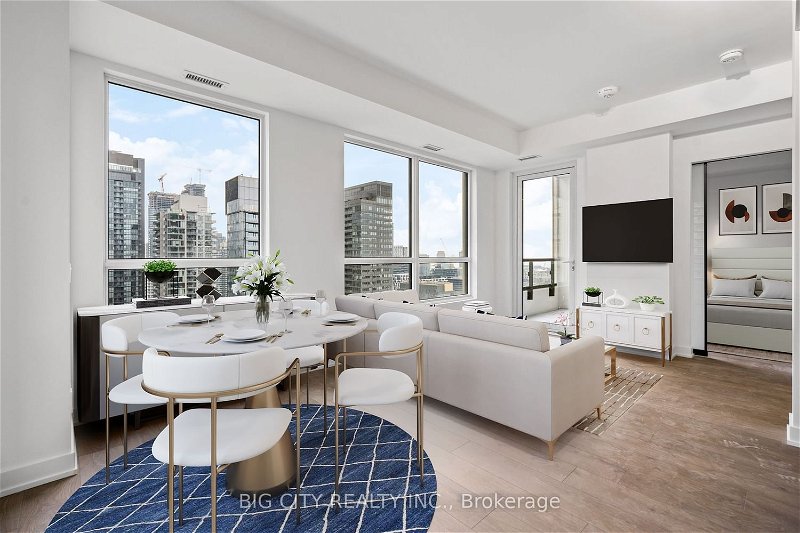
3006 - 350 Adelaide Street W
For SalePeter & Adelaide CondosEst Sell Timeframe 25 Days
$965,000
Price Cut: $1,025,000
2 Beds
2 Bath
1 Parking
700 - 799 SQFT
50 Days on Strata
Listing History
Unit Highlights
Property Type:
Condo
Cost Per Sqft:
$1,208 - $1,379/sqft
Maintenance Fees:
$600/mth
Taxes:
$0 (2024)
Locker:
Owned
Outdoor Space:
Balcony
Exposure:
South East
Possession Date:
To Be Determined
Buyer's Market
Balanced
Seller's Market
Maintenance Fees
Included
Parking
Building Maintenance
Building Insurance
Excluded
Hydro
Heat
Air Conditioning
Water
Unit Details
- Air Conditioning
- Central Air
- Heat Source
- Electric
- Heating
- Fan Coil
- Ensuite Laundry
- Yes
Room Dimensions
Living
17.72 x 12.99ft
Dining
17.72 x 12.99ft
Prim Bdrm
8.99 x 10.79ft
About this Listing
Brand New, Corner 2-Bedroom Apartment At Peter & Adelaide. Panoramic City Views From The 30th Floor! Integrated, European Appliances In A Highly Efficient Floor Plan. Full Amenity Program In The Building, Including A Rooftop Pool With Cabanas & Lounge Deck. The Entertainment District, King Street, TTC, Theatres (TIFF), Financial Core All Steps Away. 1 Parking Space & 1 Storage Locker Included.
ExtrasAll Existing Appliances & Electric Light Fixtures. 1 Parking Space & 1 Storage Locker.
big city realty inc.MLS® #C8175892
Amenities
Sauna
Games Room
Gym Room
Outdoor Pool
Concierge
Indoor Parking
Nearby Amenities
Unknown
Walkability
Unknown
Transit
Unknown
Bikeability
Demographics
Based on the dissemination area as defined by Statistics Canada. A dissemination area contains, on average, approximately 200 – 400 households.
Population
18,483
Average Individual Income
$71,628
Average Household Size
3 persons
Average Age
42
Average Household Income
$108,396
Dominant Housing Type
High Rise Apartment
Population By Age
Household Income
Housing Types & Tenancy
High Rise Apartment
43%
Semi Detached
25%
Detached
24%
Low Rise Apartment
3%
Duplex
2%
Marital Status
Commute
Languages (Primary Language)
Other
72%
Mandarin
13%
Cantonese
9%
Tagalog
2%
Arabic
1%
Spanish
1%
Urdu
1%
Korean
1%
Education
University and Above
43%
High School
21%
College
15%
None
12%
University Below Batchelor
3%
Apprenticeship
2%
Major Field of Study
Business Management
25%
Architecture & Engineering
17%
Social Sciences
12%
Health & Related Fields
10%
Math & Computer Sciences
8%
Humanities
6%
Physical Sciences
5%
Education
5%
Visual & Performing Arts
3%
Personal, Protective & Transportation Services
2%
Price Trends
Building Trends At Peter & Adelaide Condos
Days on Strata
Units at Peter & Adelaide Condos spend an average of
10
Days on Strata
based on recent sales
List vs Selling Price
On average, these condos sell for
2%
above
the list price.
Offer Competition
Condos in this building have an
AVERAGEchance of receiving
Multiple Offers
Turnover of Units
On average, each unit is owned for
N/A
Property Value
0%
Increase in property value within the past twelve months
Price Ranking
6th
Highest price per SQFT out of 51 condos in the Queen West area
Sold Units
3
Units were Sold over the past twelve months
Rented Units
408
Units were Rented over the past twelve months
Best Value Rank
Peter & Adelaide Condos offers the best value out of 51 condos in the Queen West neighbourhood
?
N/A
Appreciation Rank
Peter & Adelaide Condos has the highest ROI out of 51 condos in the Queen West neighbourhood
?
N/A
Rental Yield
Peter & Adelaide Condos yields the highest rent prices out of 51 condos in the Queen West neighbourhood
?
N/A
High Demand
Peter & Adelaide Condos is the most popular building out of 51 condos in the Queen West neighbourhood
?
N/A
Transaction Insights at 350 Adelaide Street W
| Studio | 1 Bed | 1 Bed + Den | 2 Bed | 2 Bed + Den | 3 Bed | |
|---|---|---|---|---|---|---|
| Price Range | No Data | $614,000 | No Data | $857,000 - $902,000 | No Data | No Data |
| Avg. Cost Per Sqft | No Data | $1,147 | No Data | $1,170 | No Data | No Data |
| Price Range | $2,150 - $2,500 | $2,050 - $2,700 | $2,250 - $2,900 | $2,600 - $3,500 | $2,950 - $3,500 | $3,300 - $4,700 |
| Avg. Wait for Unit Availability | No Data | No Data | No Data | 25 Days | No Data | No Data |
| Avg. Wait for Unit Availability | 22 Days | 3 Days | 2 Days | 2 Days | 9 Days | 8 Days |
| Ratio of Units in Building | 1% | 20% | 35% | 31% | 7% | 9% |
