3904 - 290 Adelaide St W
Listing History
Unit Highlights
Maintenance Fees
Utility Type
- Air Conditioning
- Central Air
- Heat Source
- Gas
- Heating
- Forced Air
Room Dimensions
About this Listing
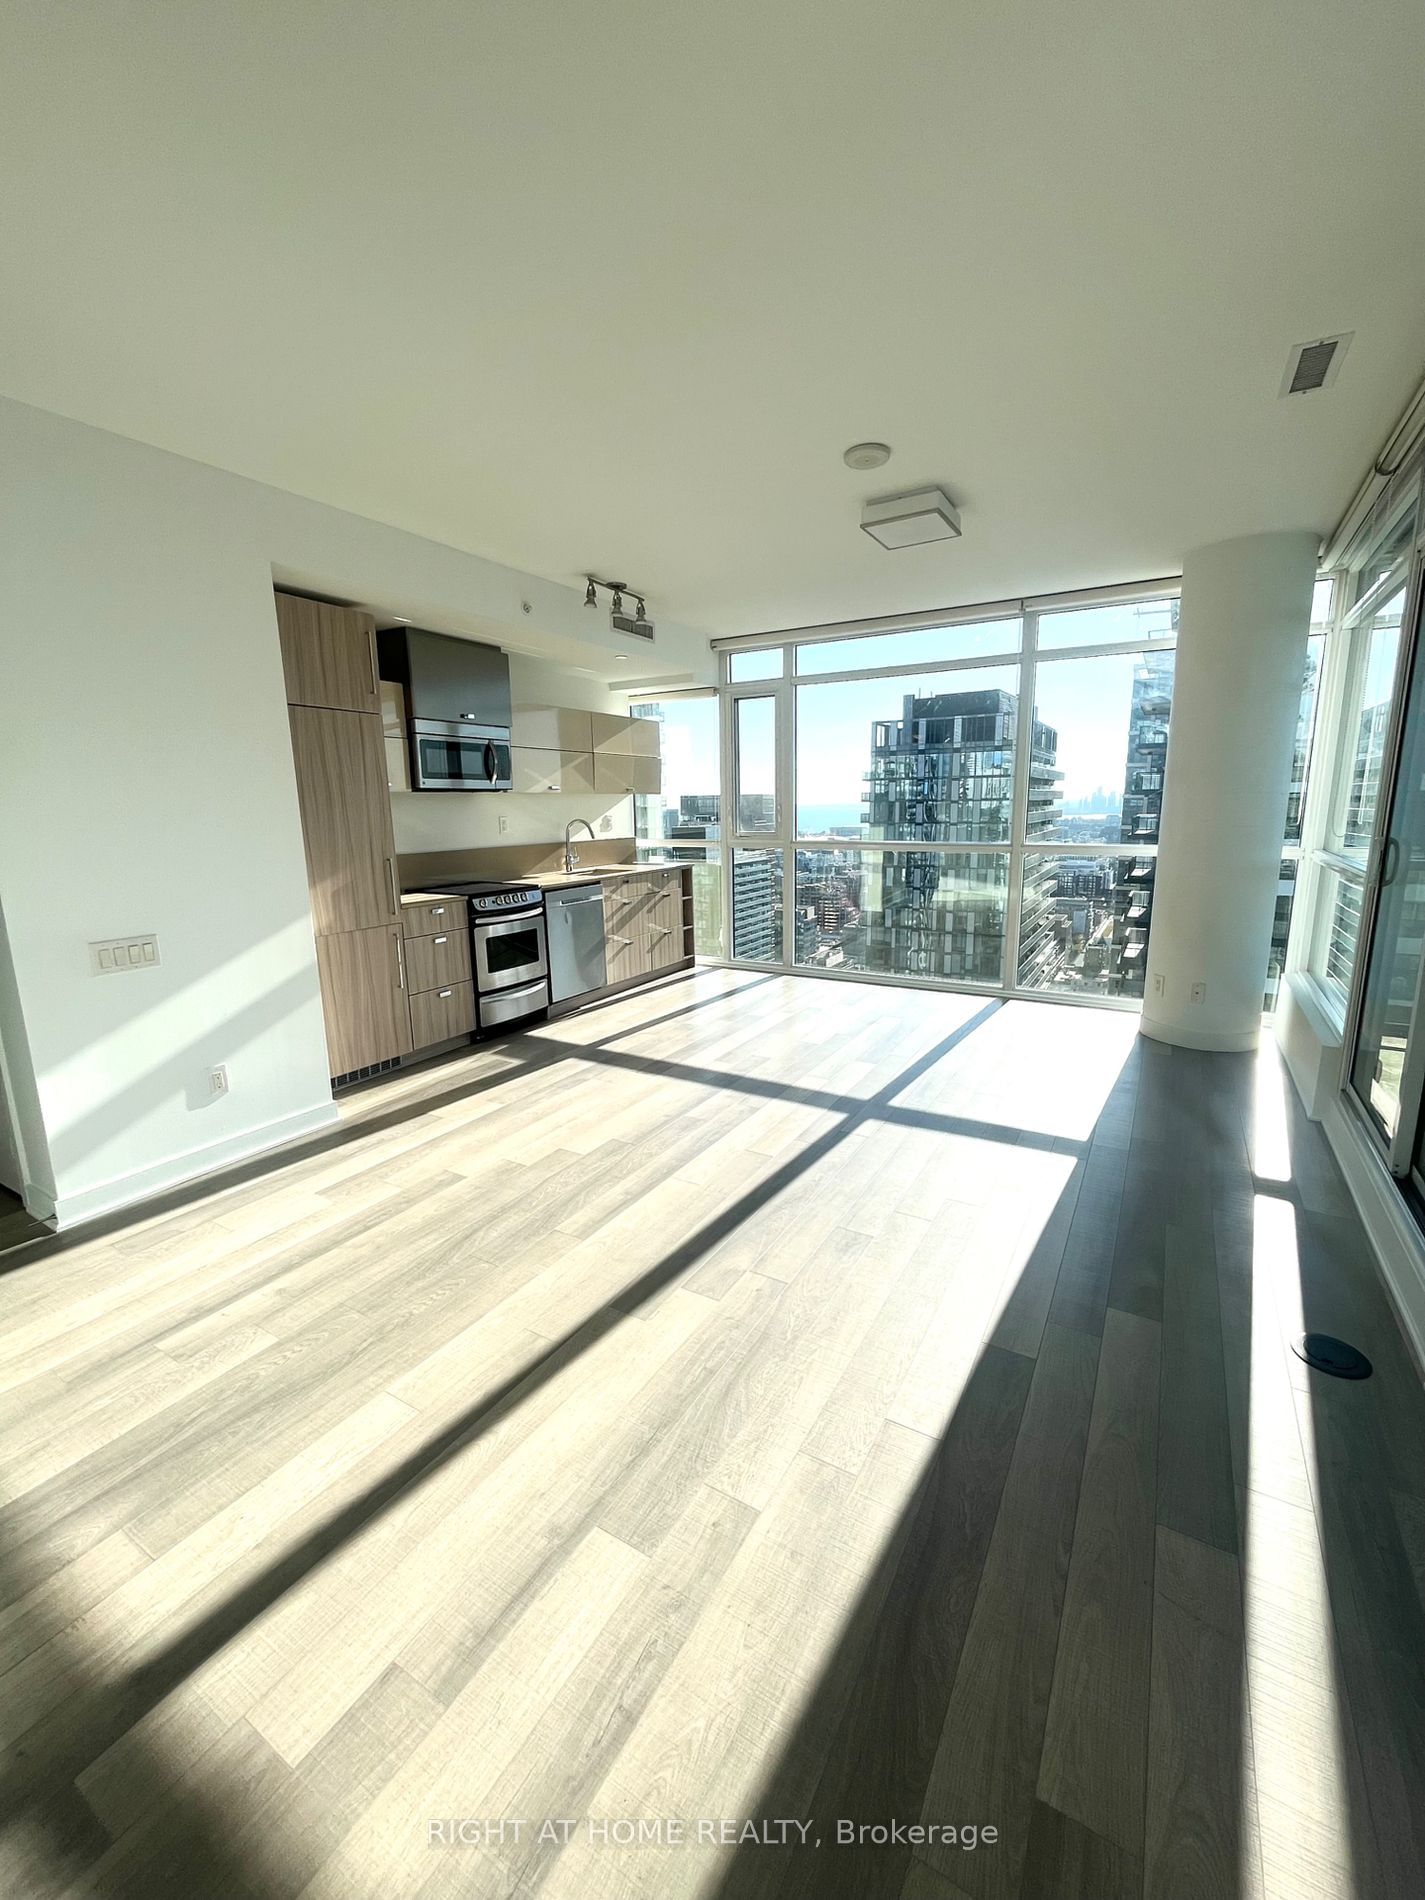
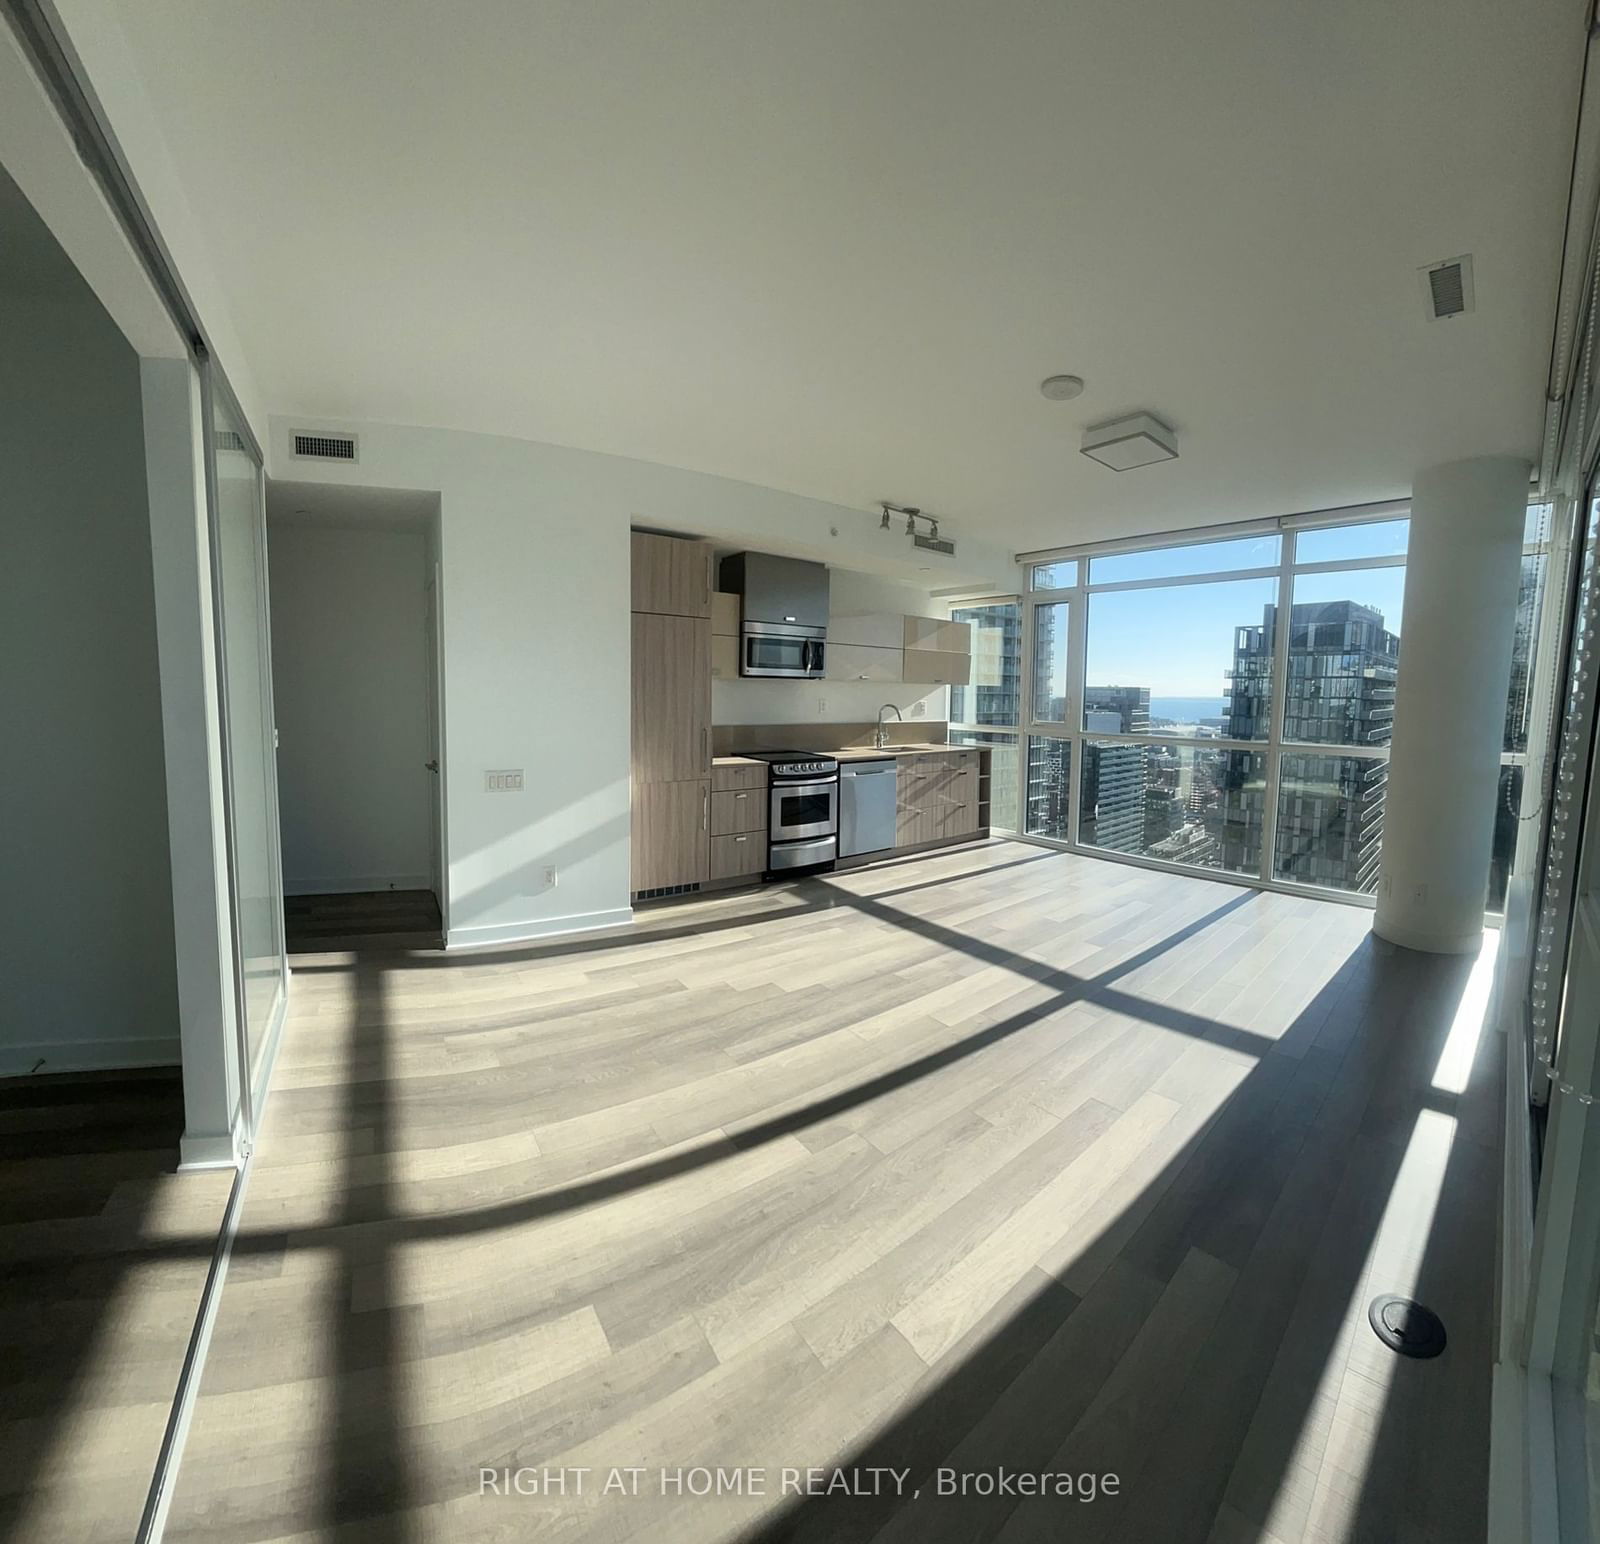
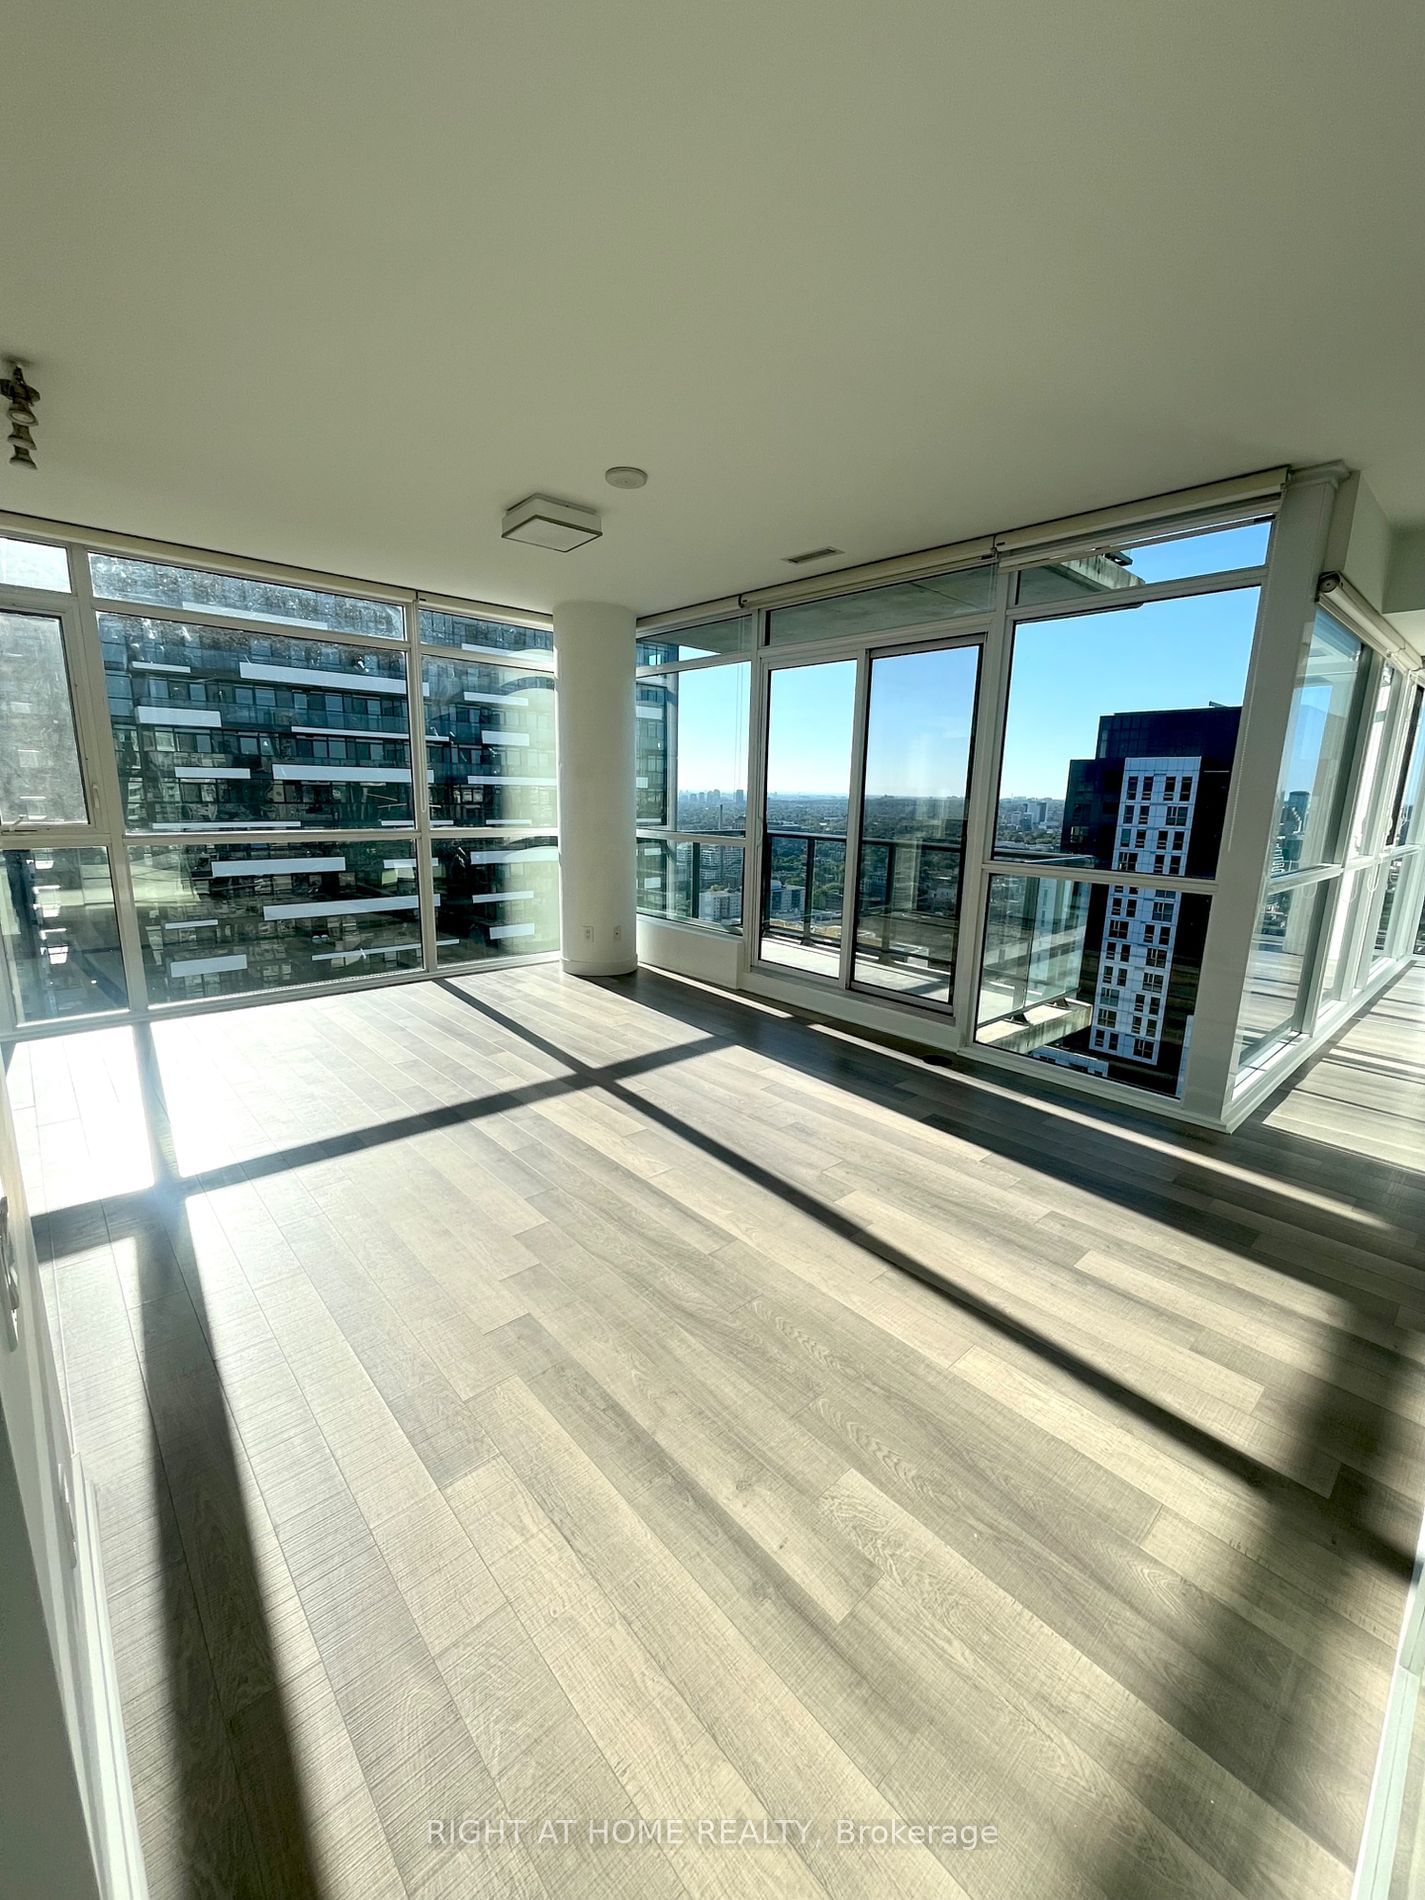
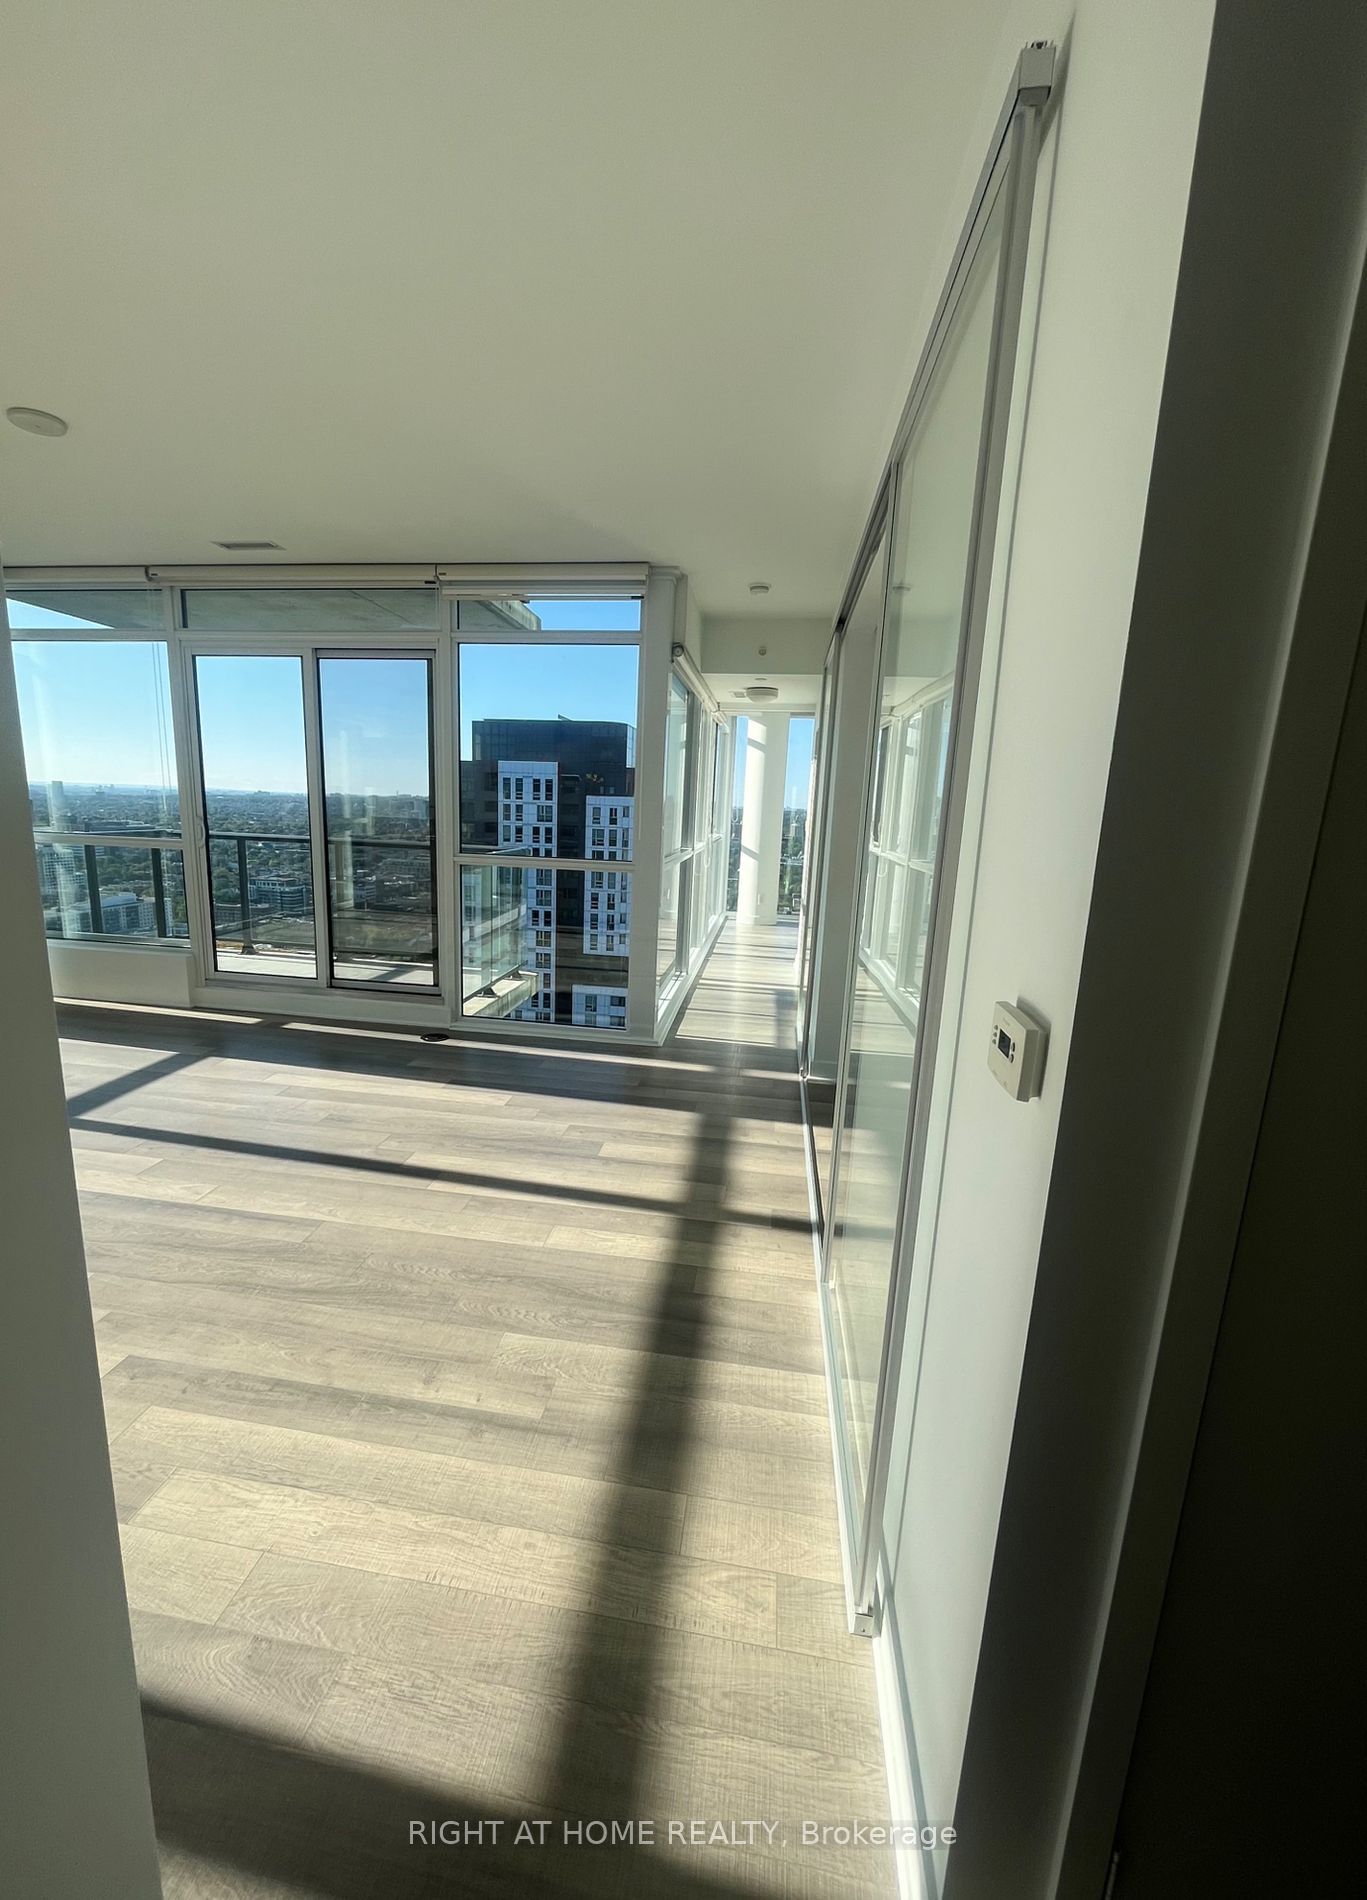
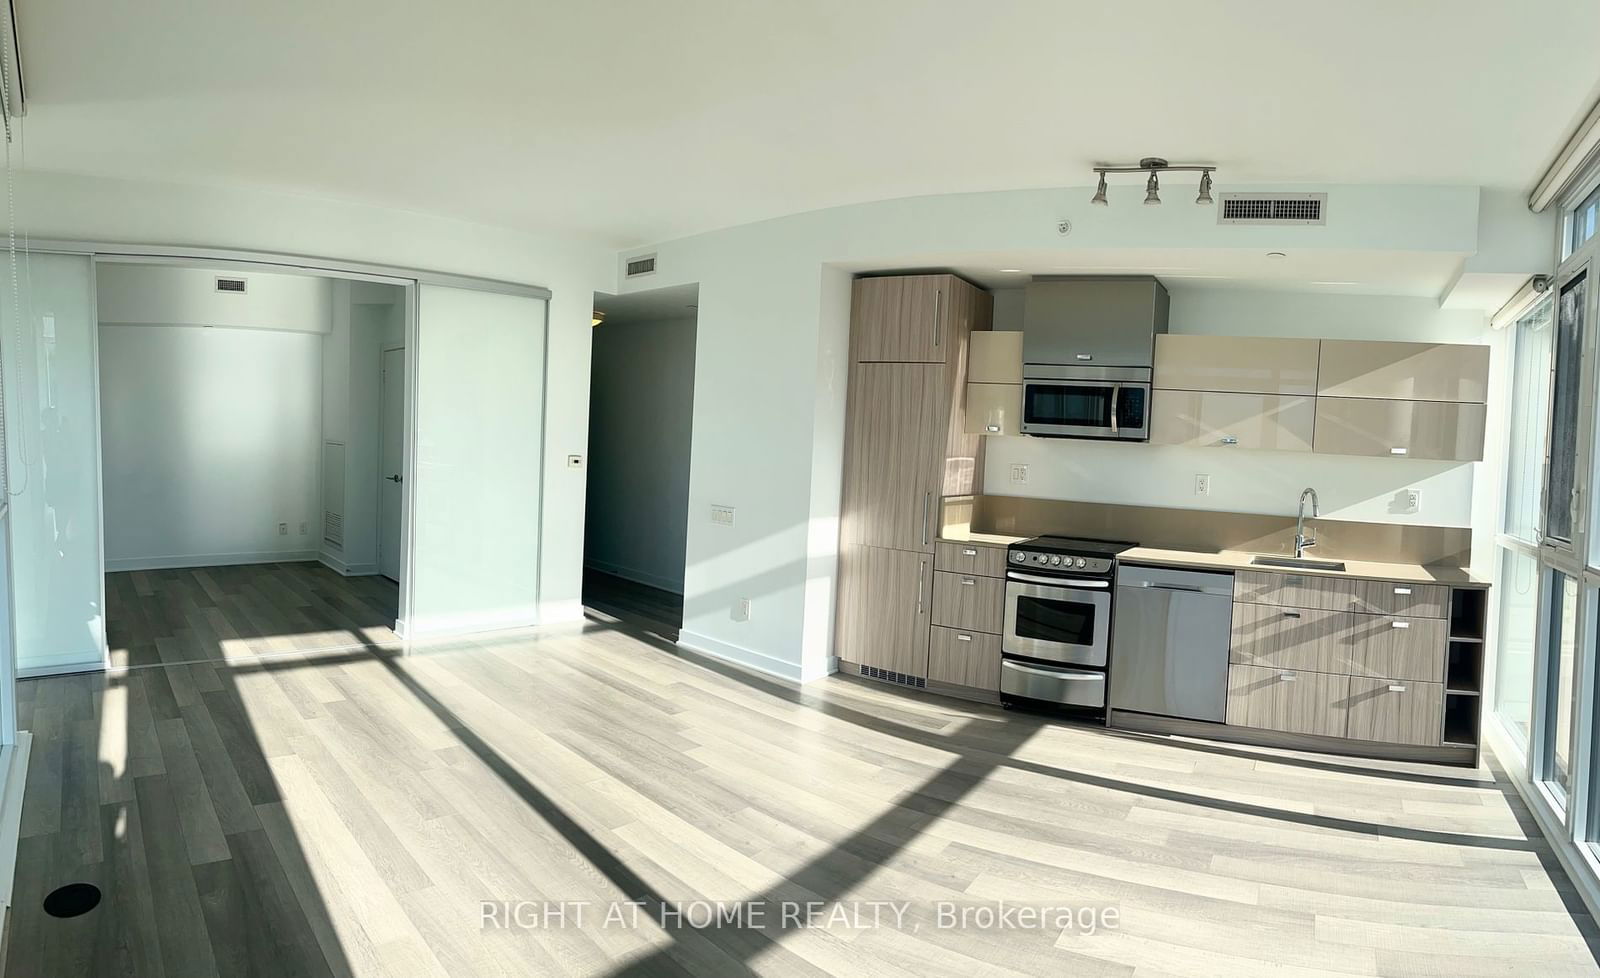
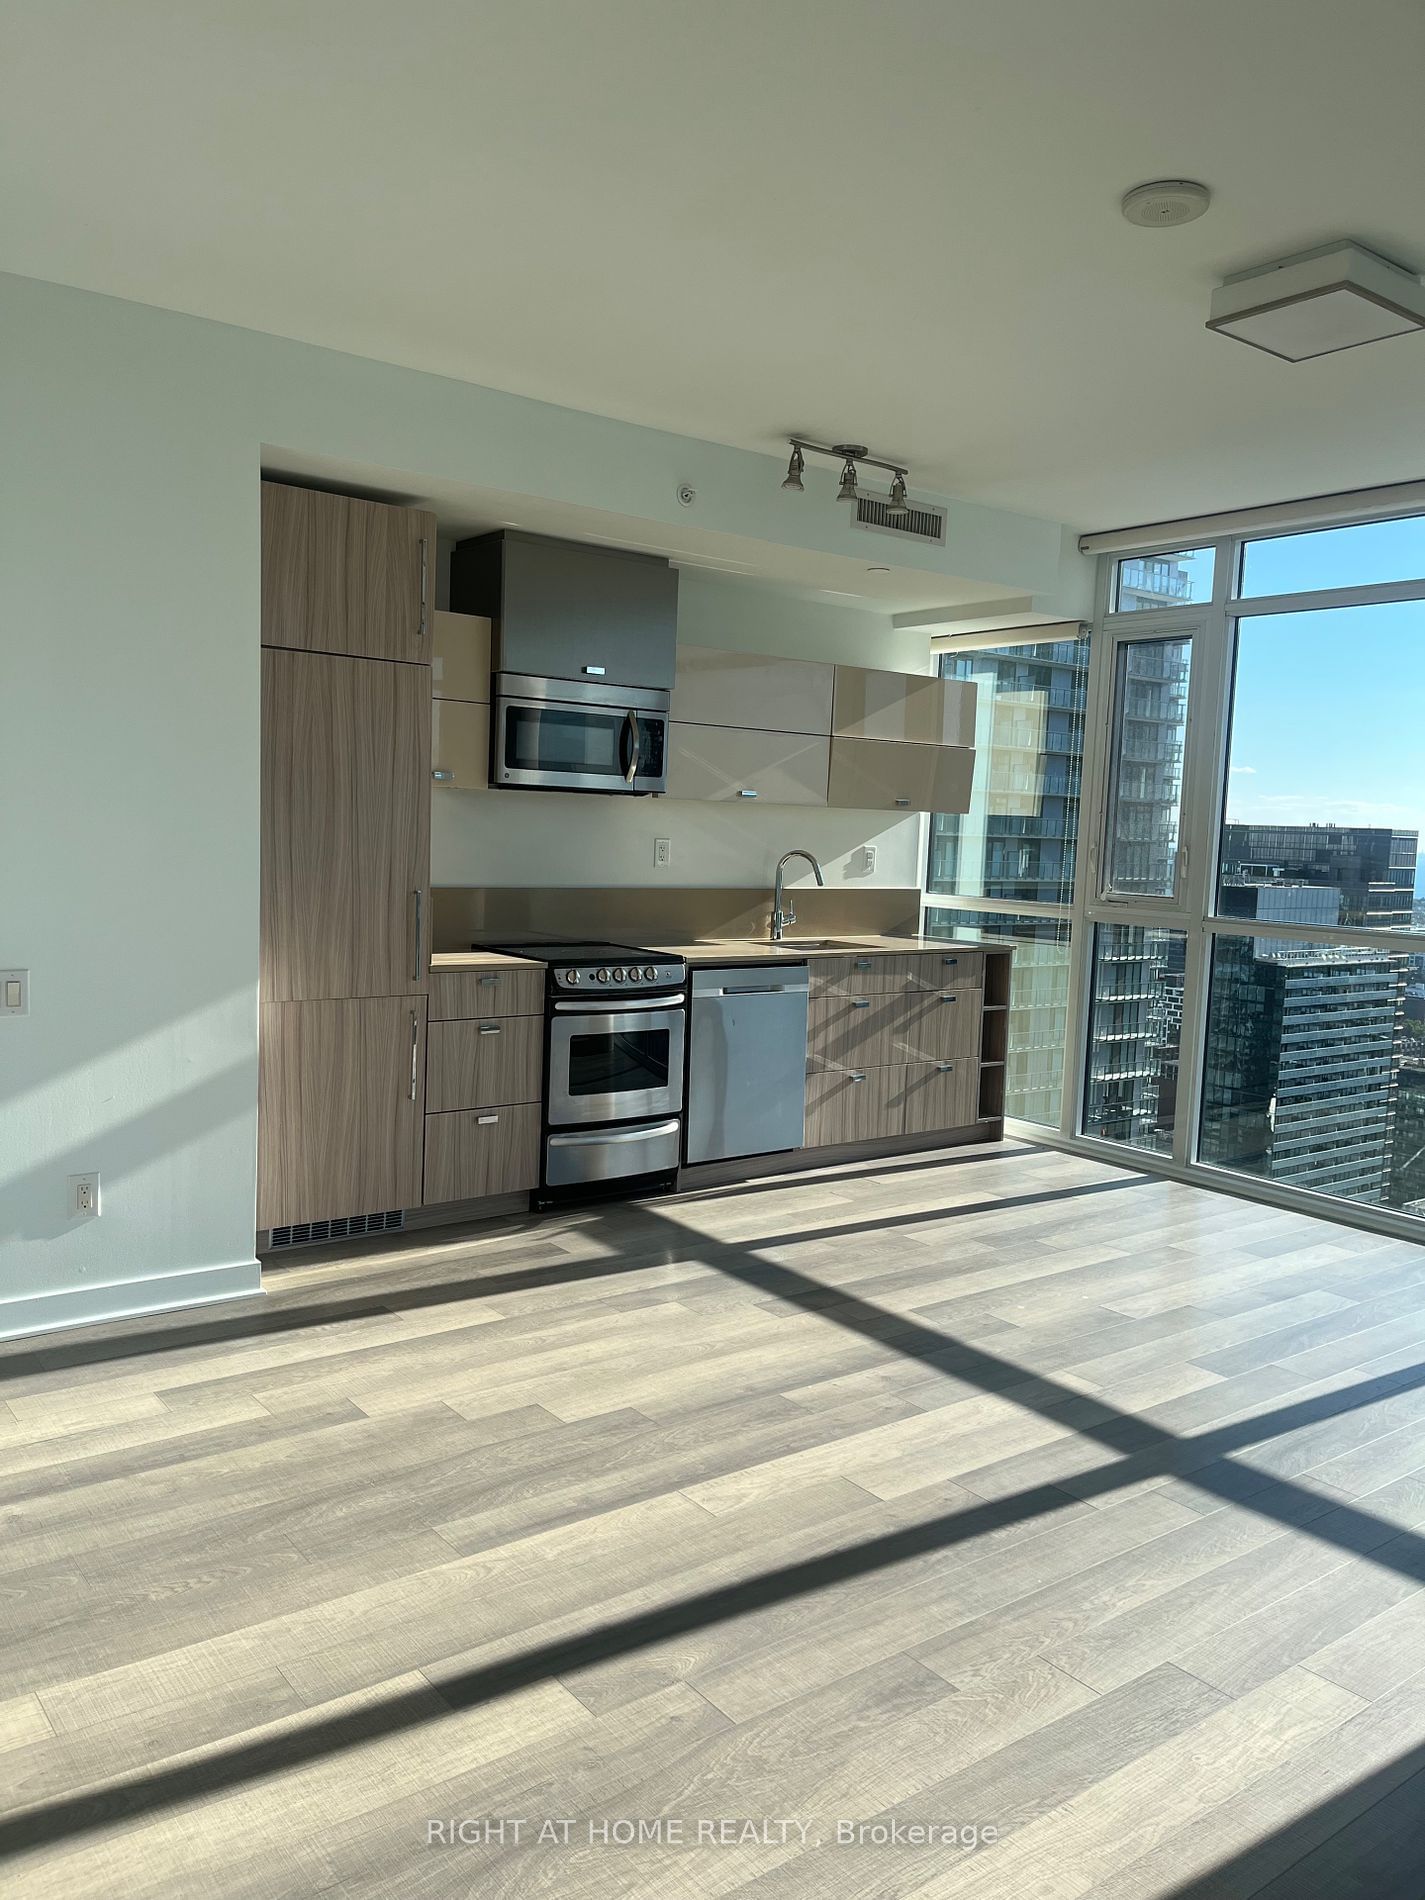
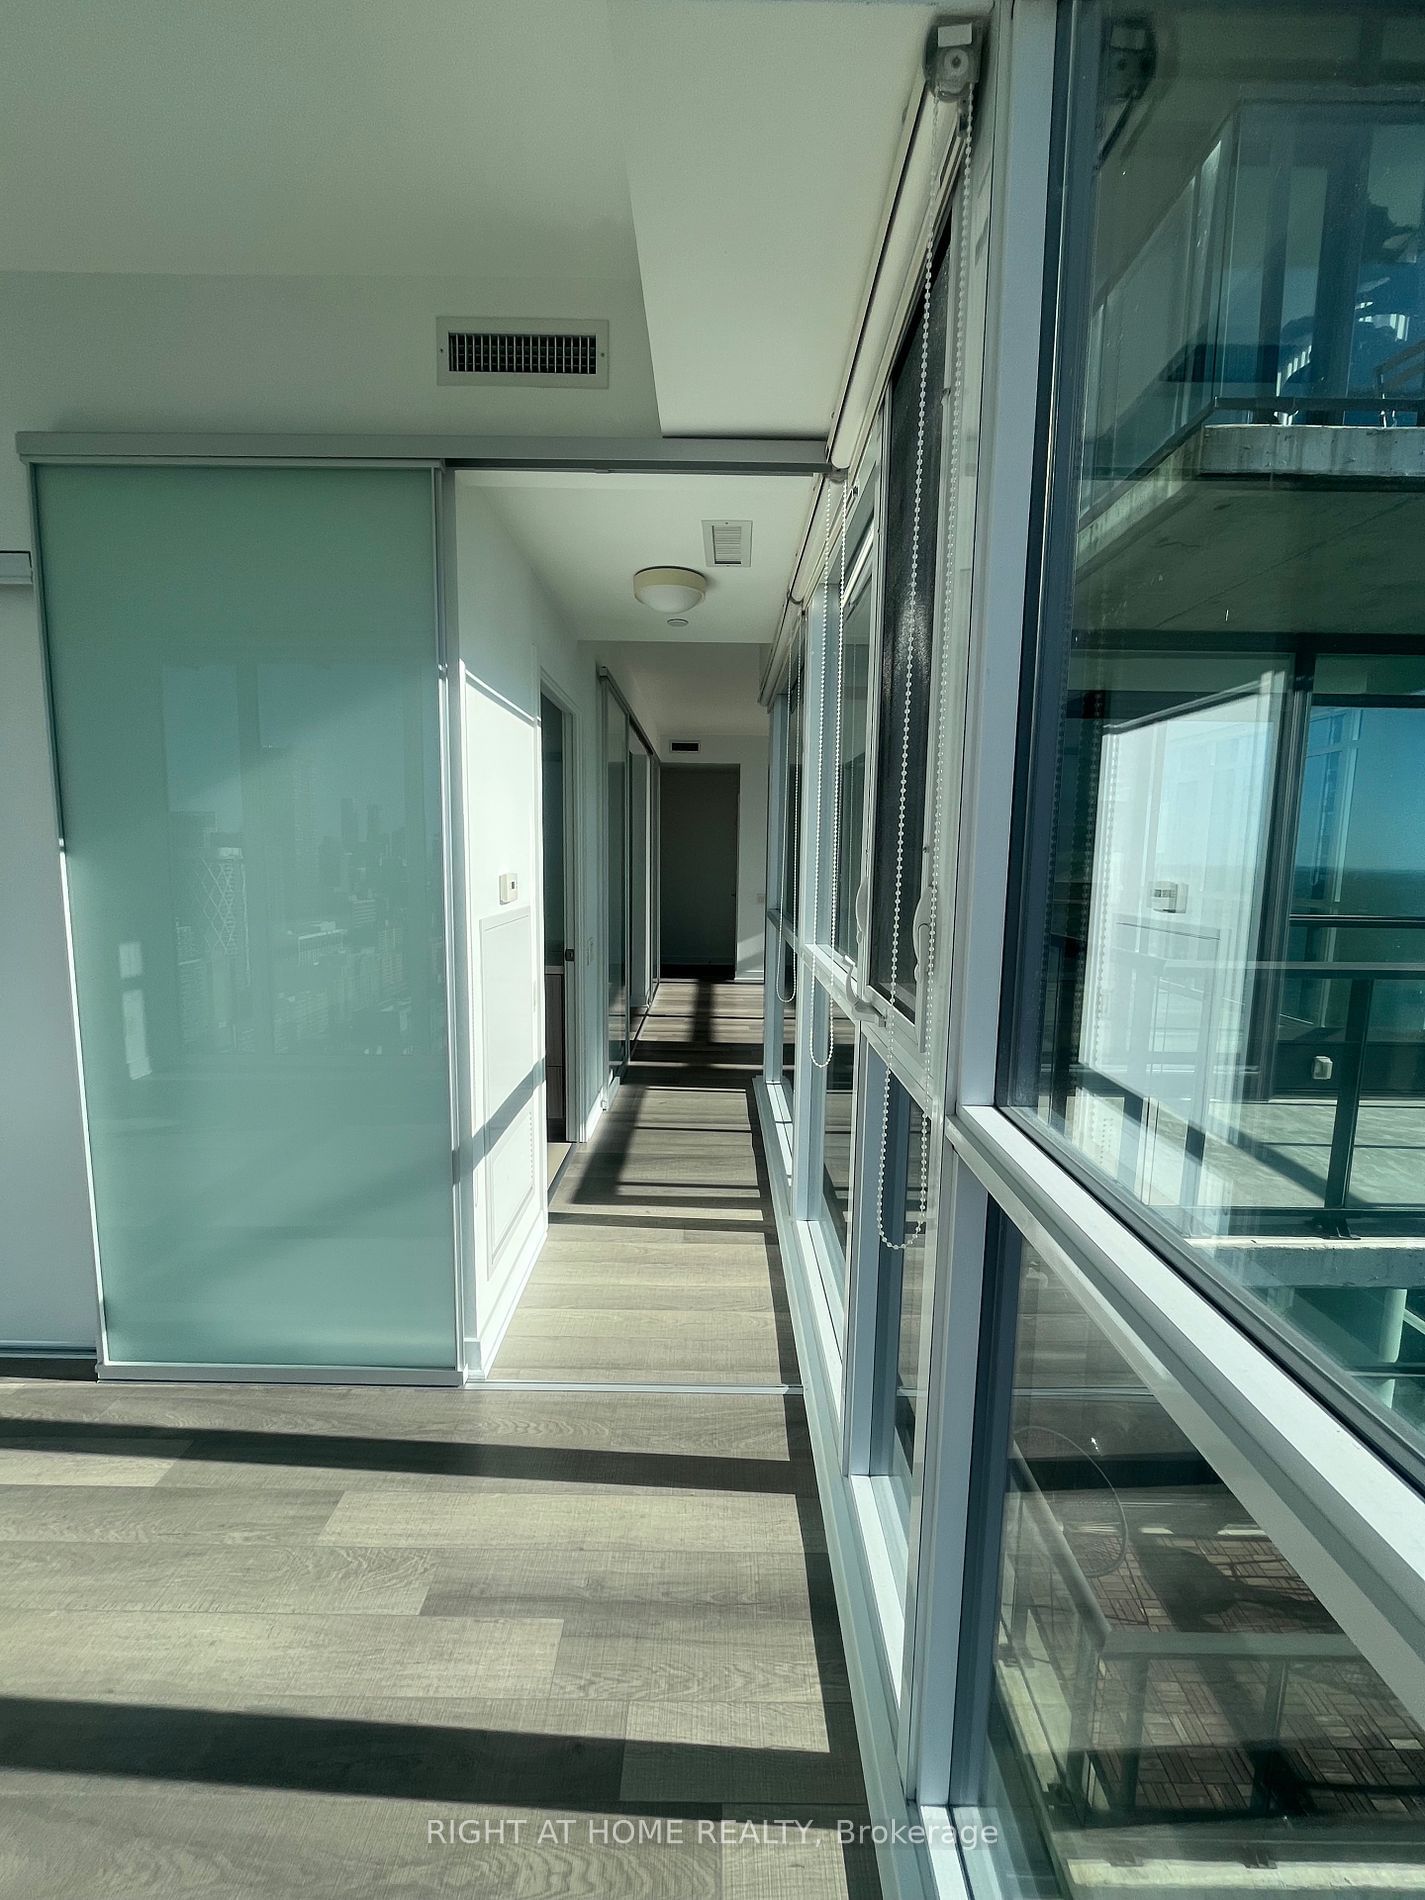
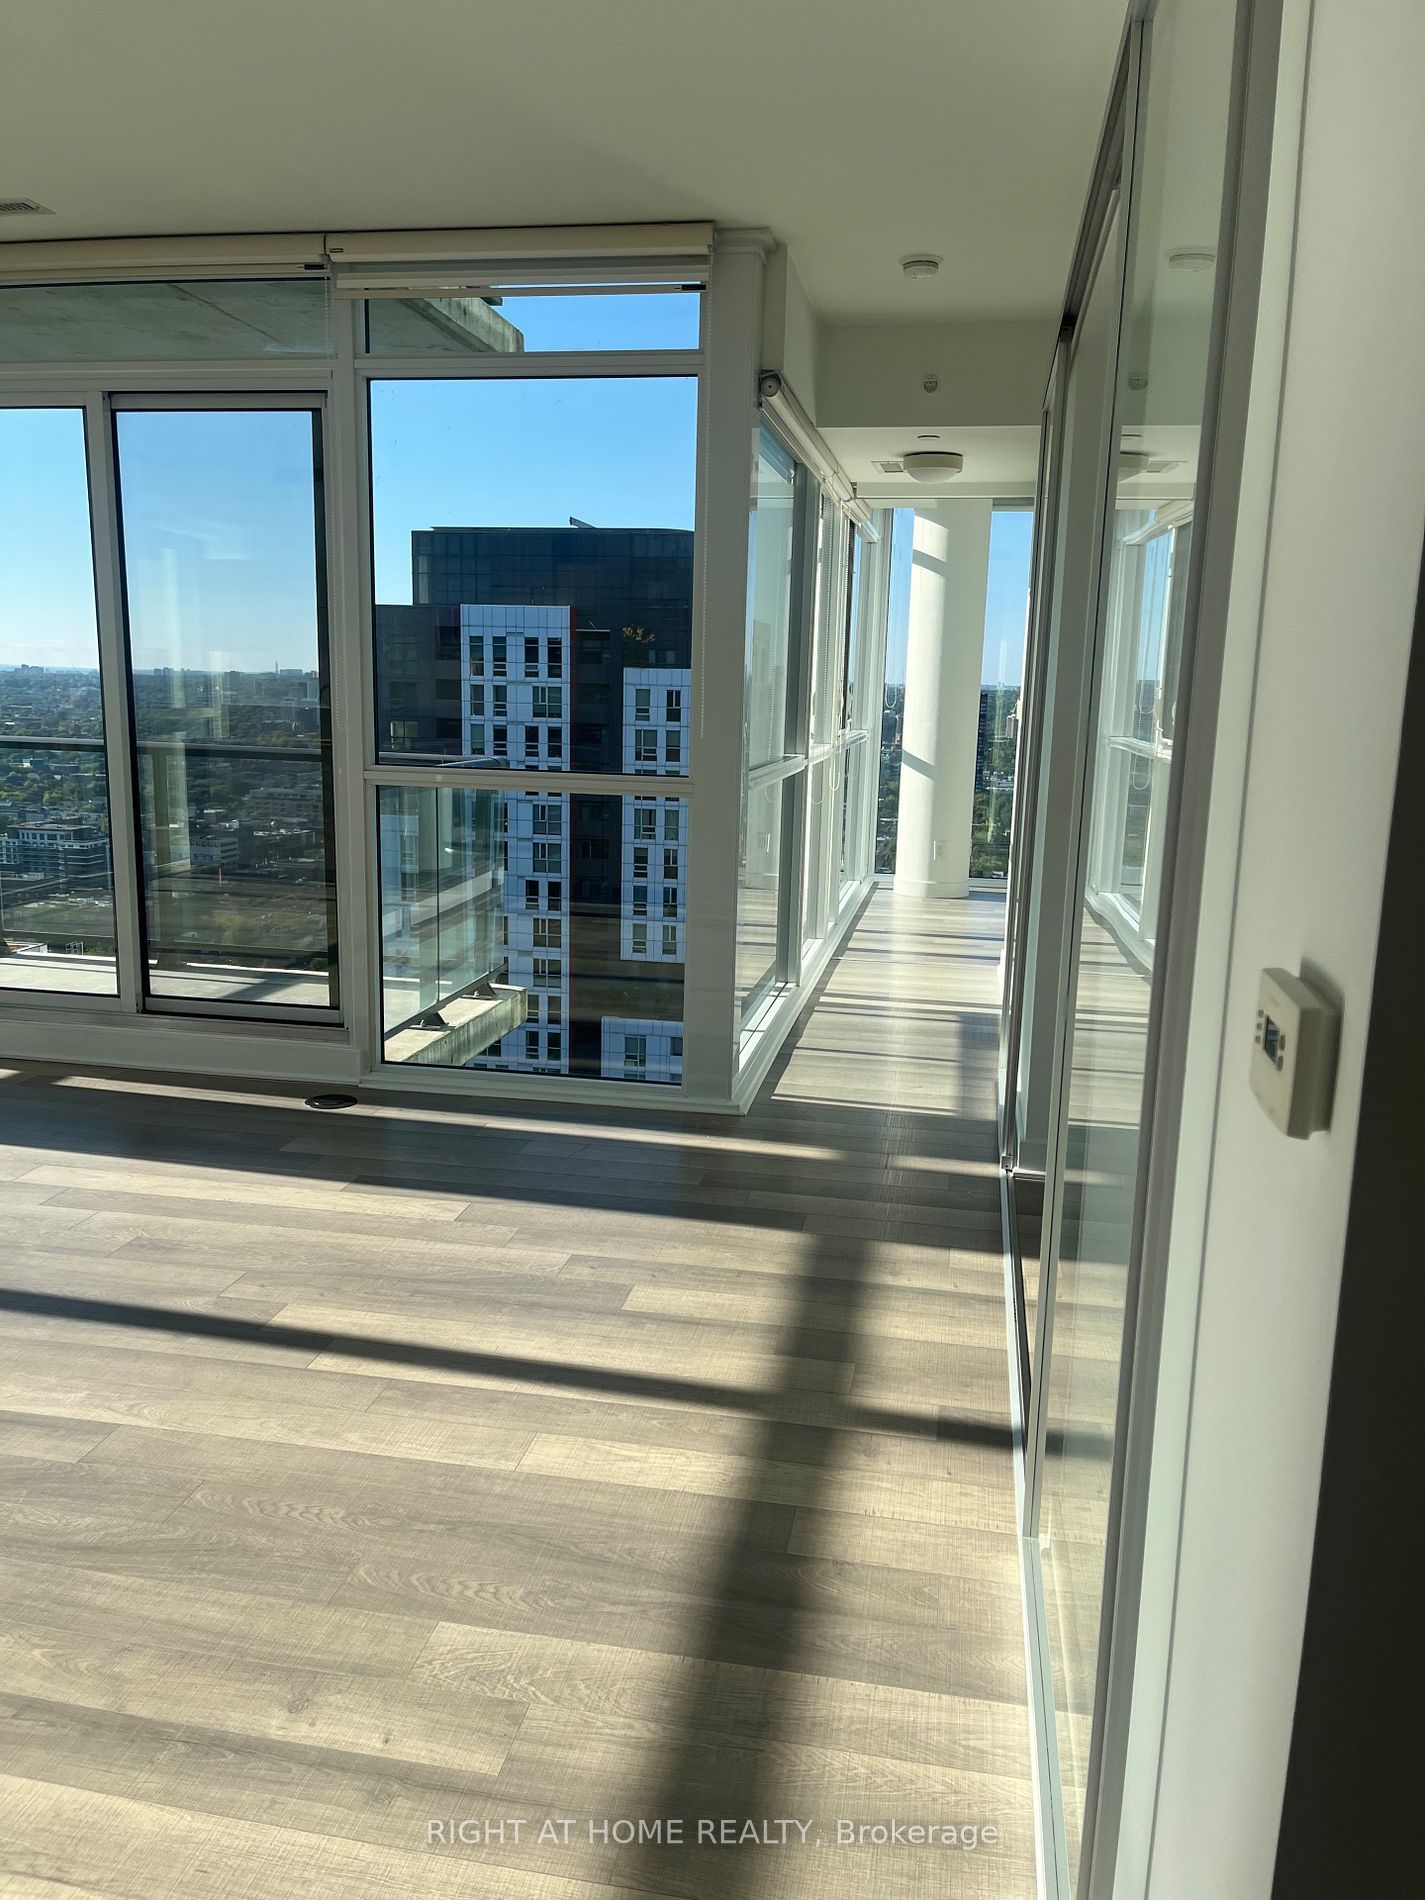
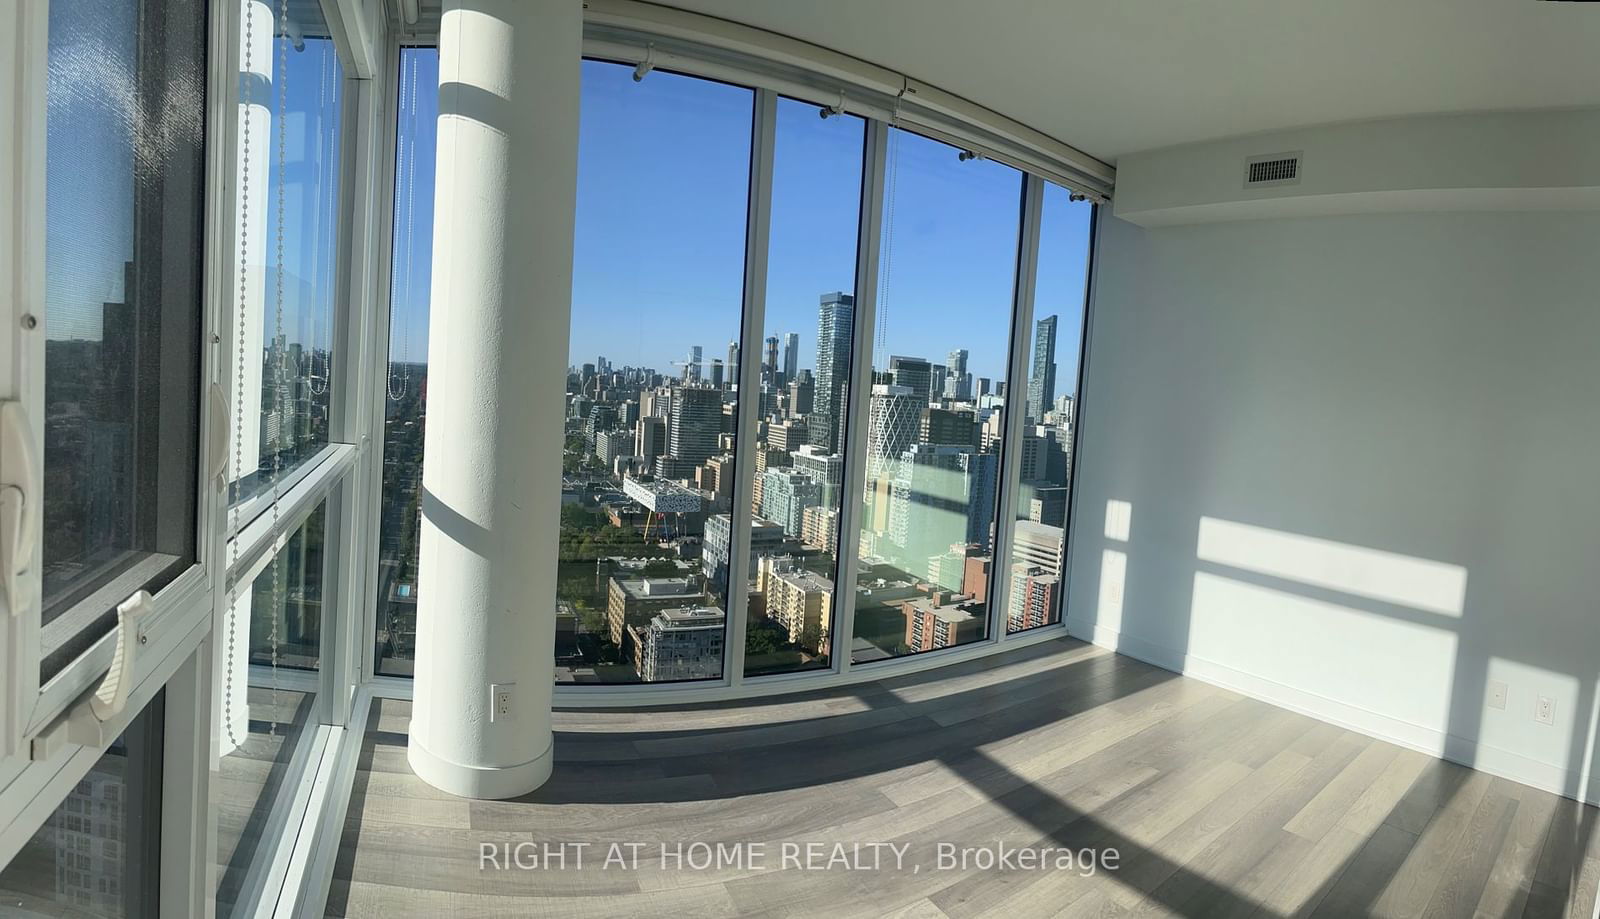
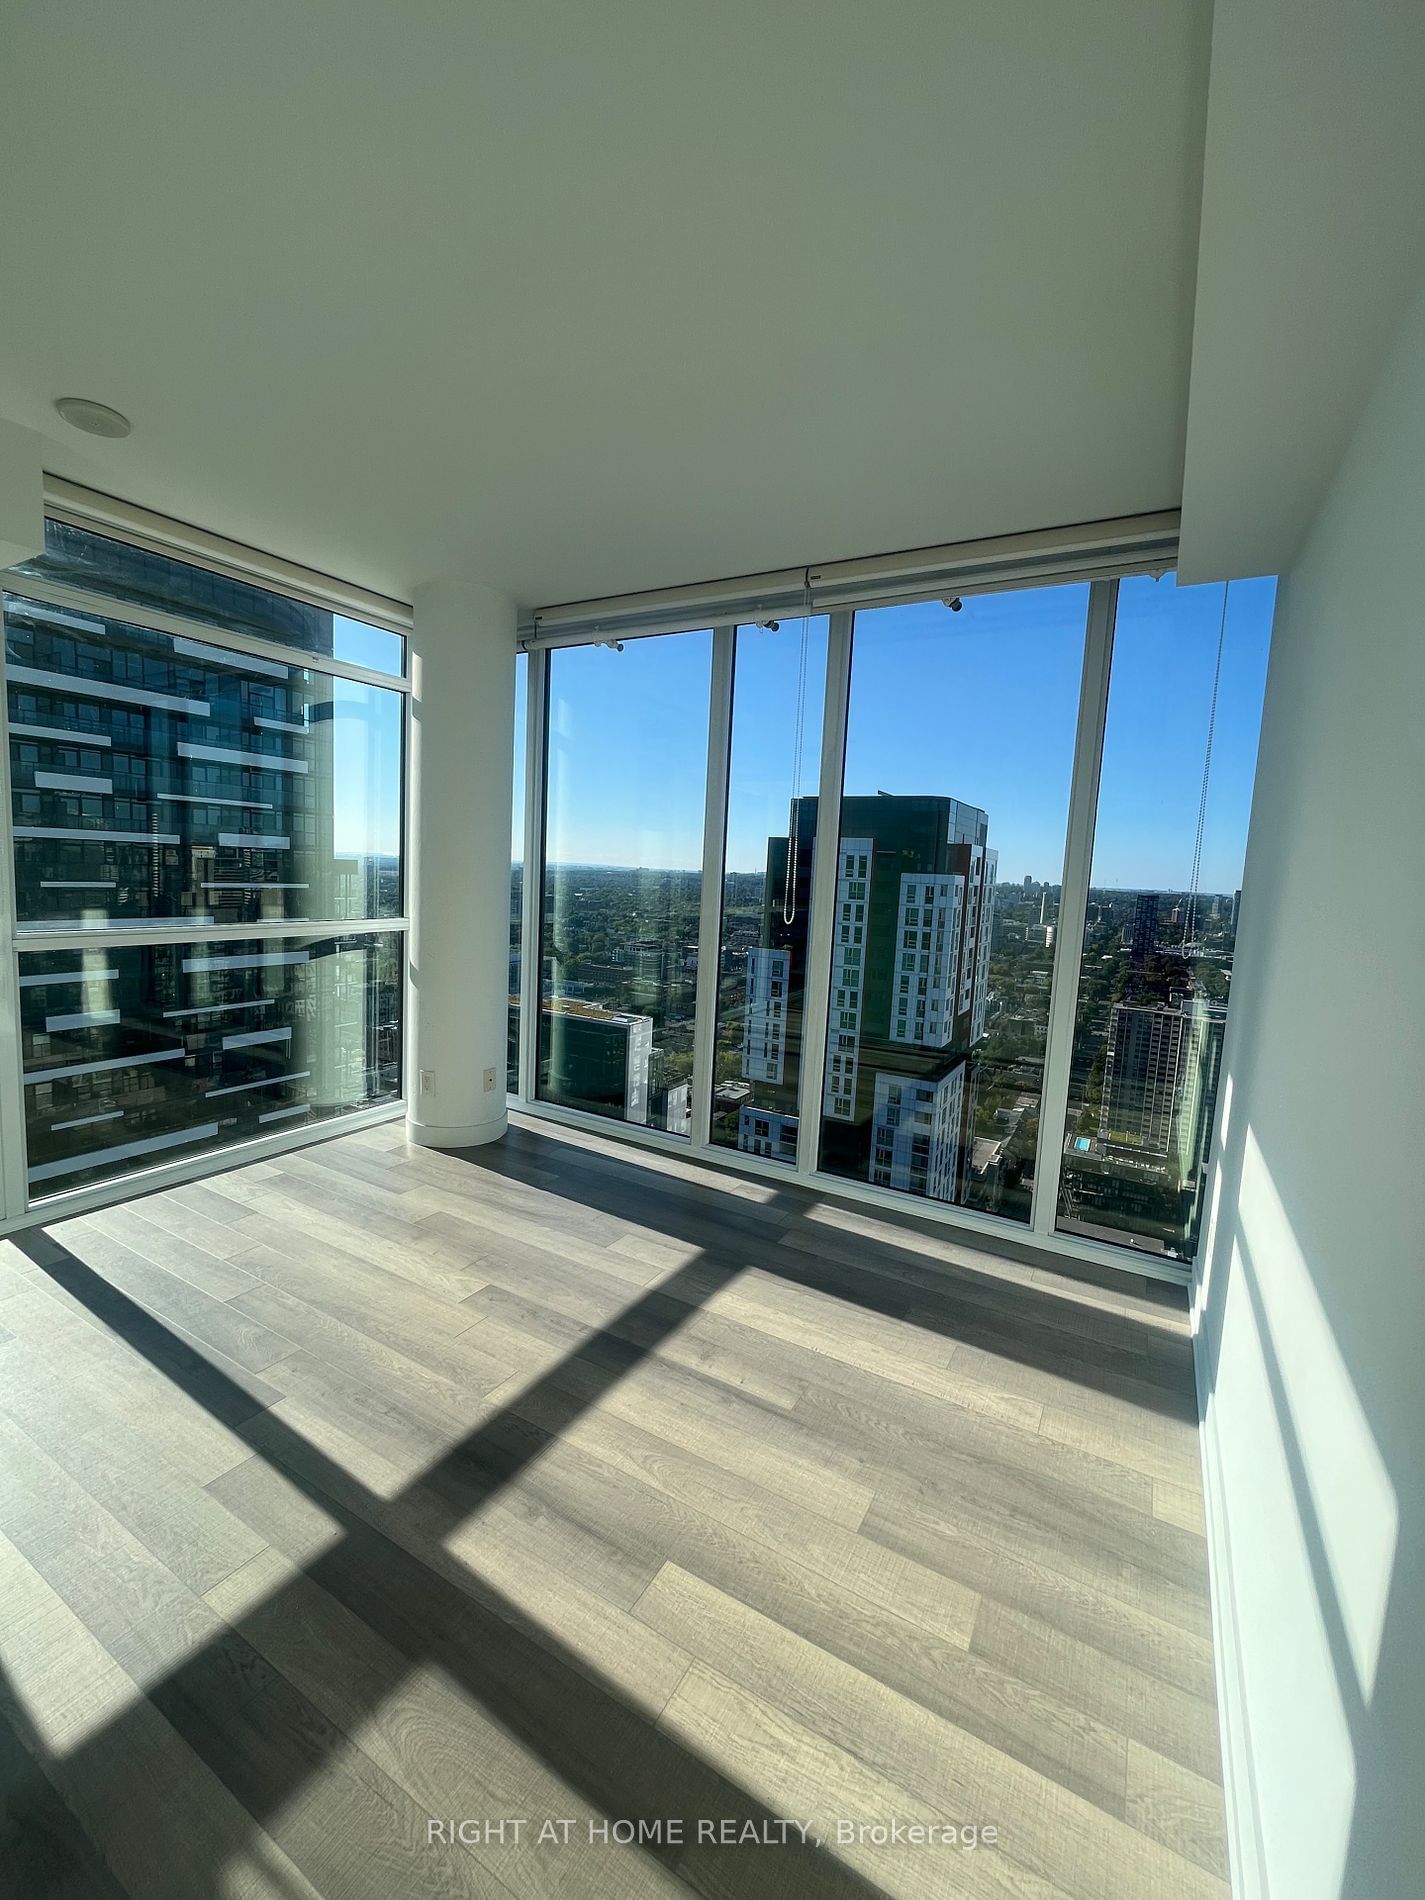
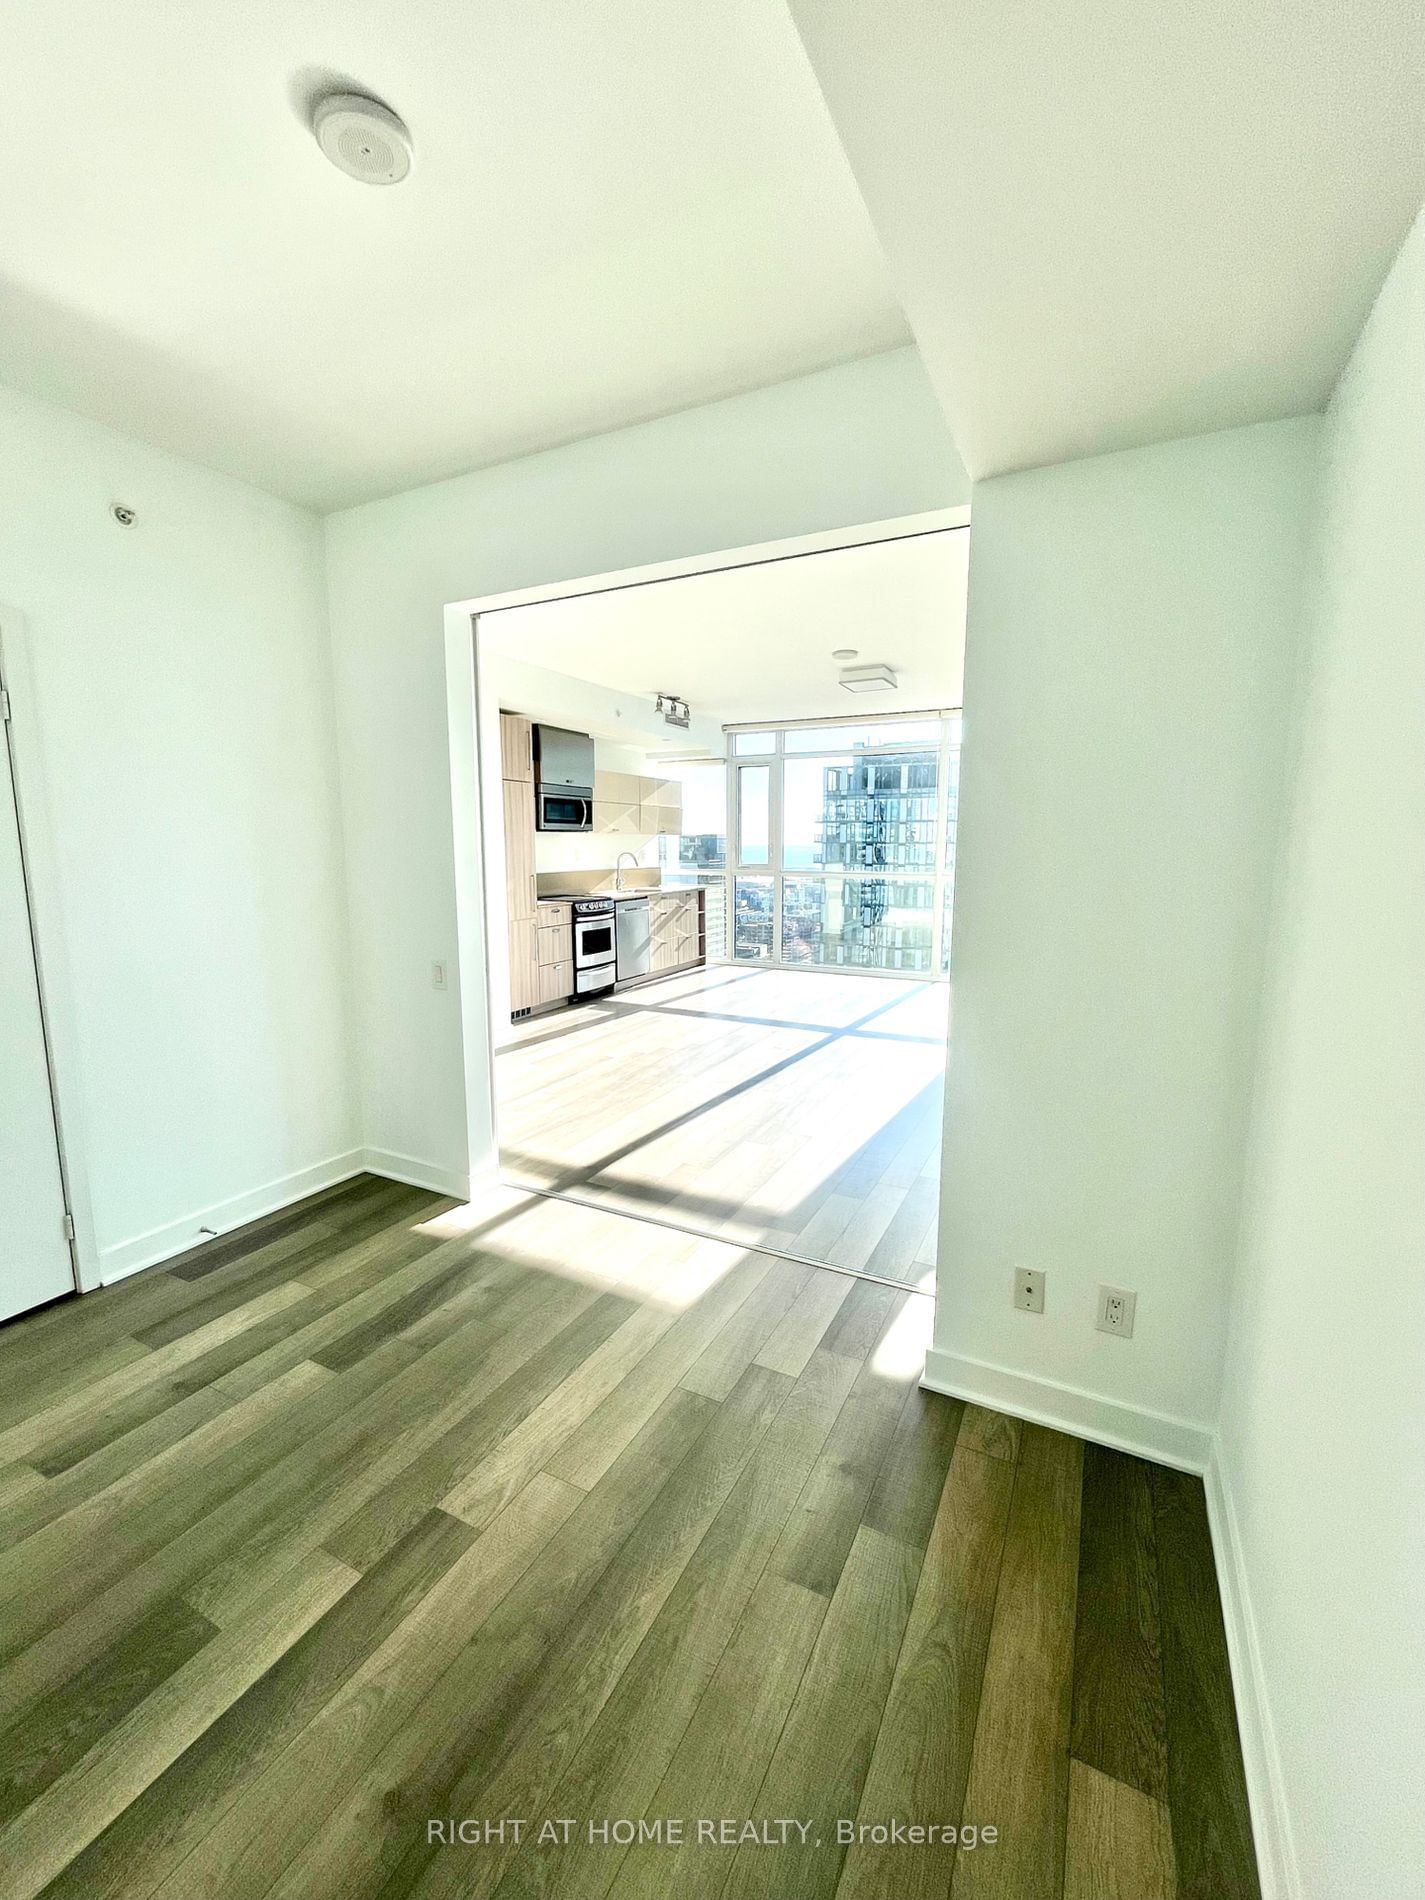
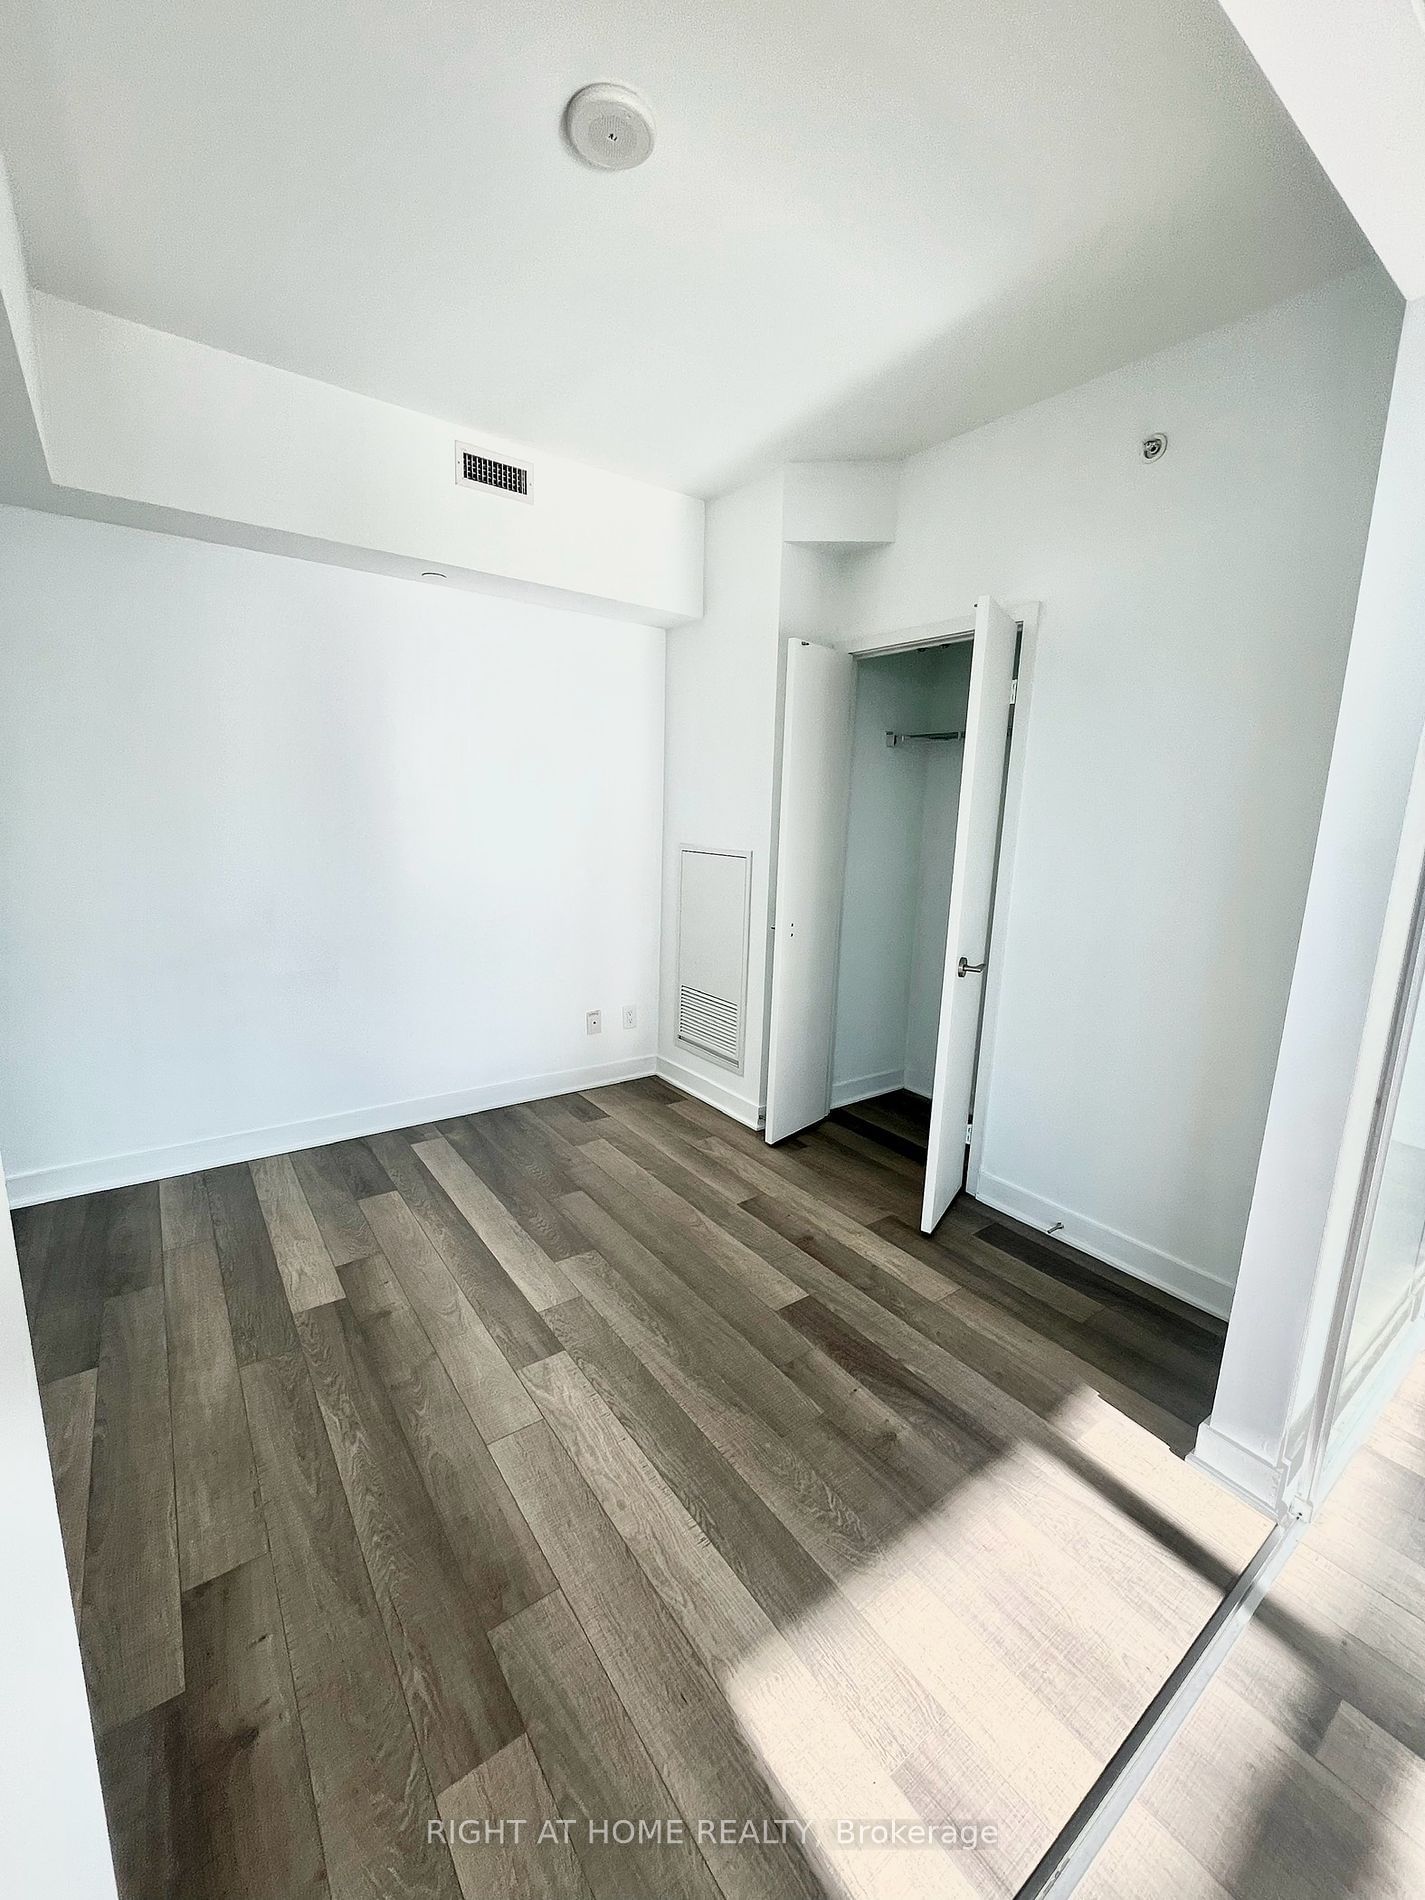
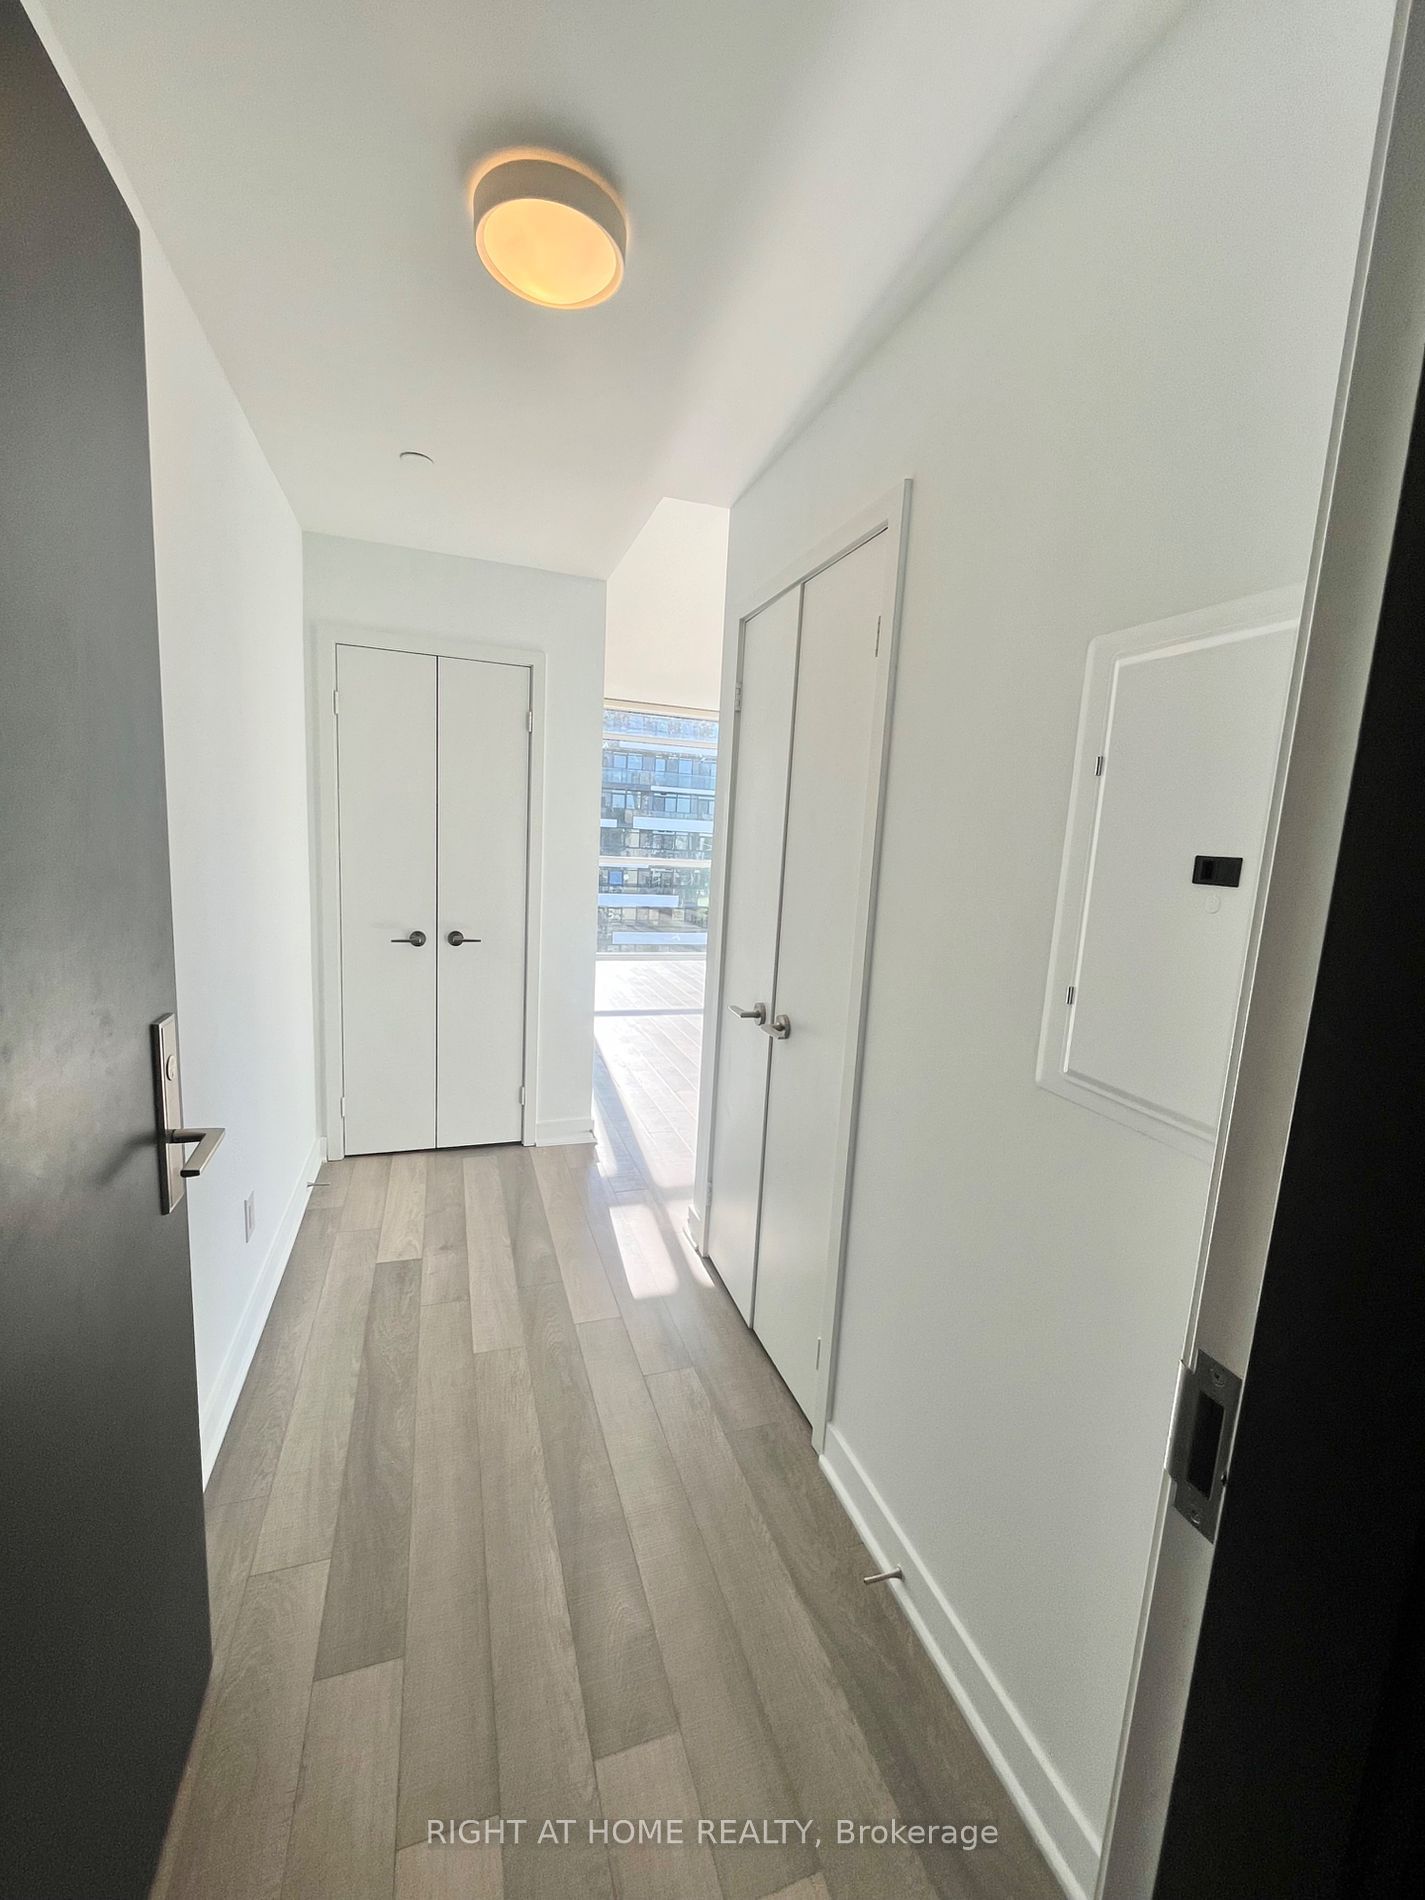
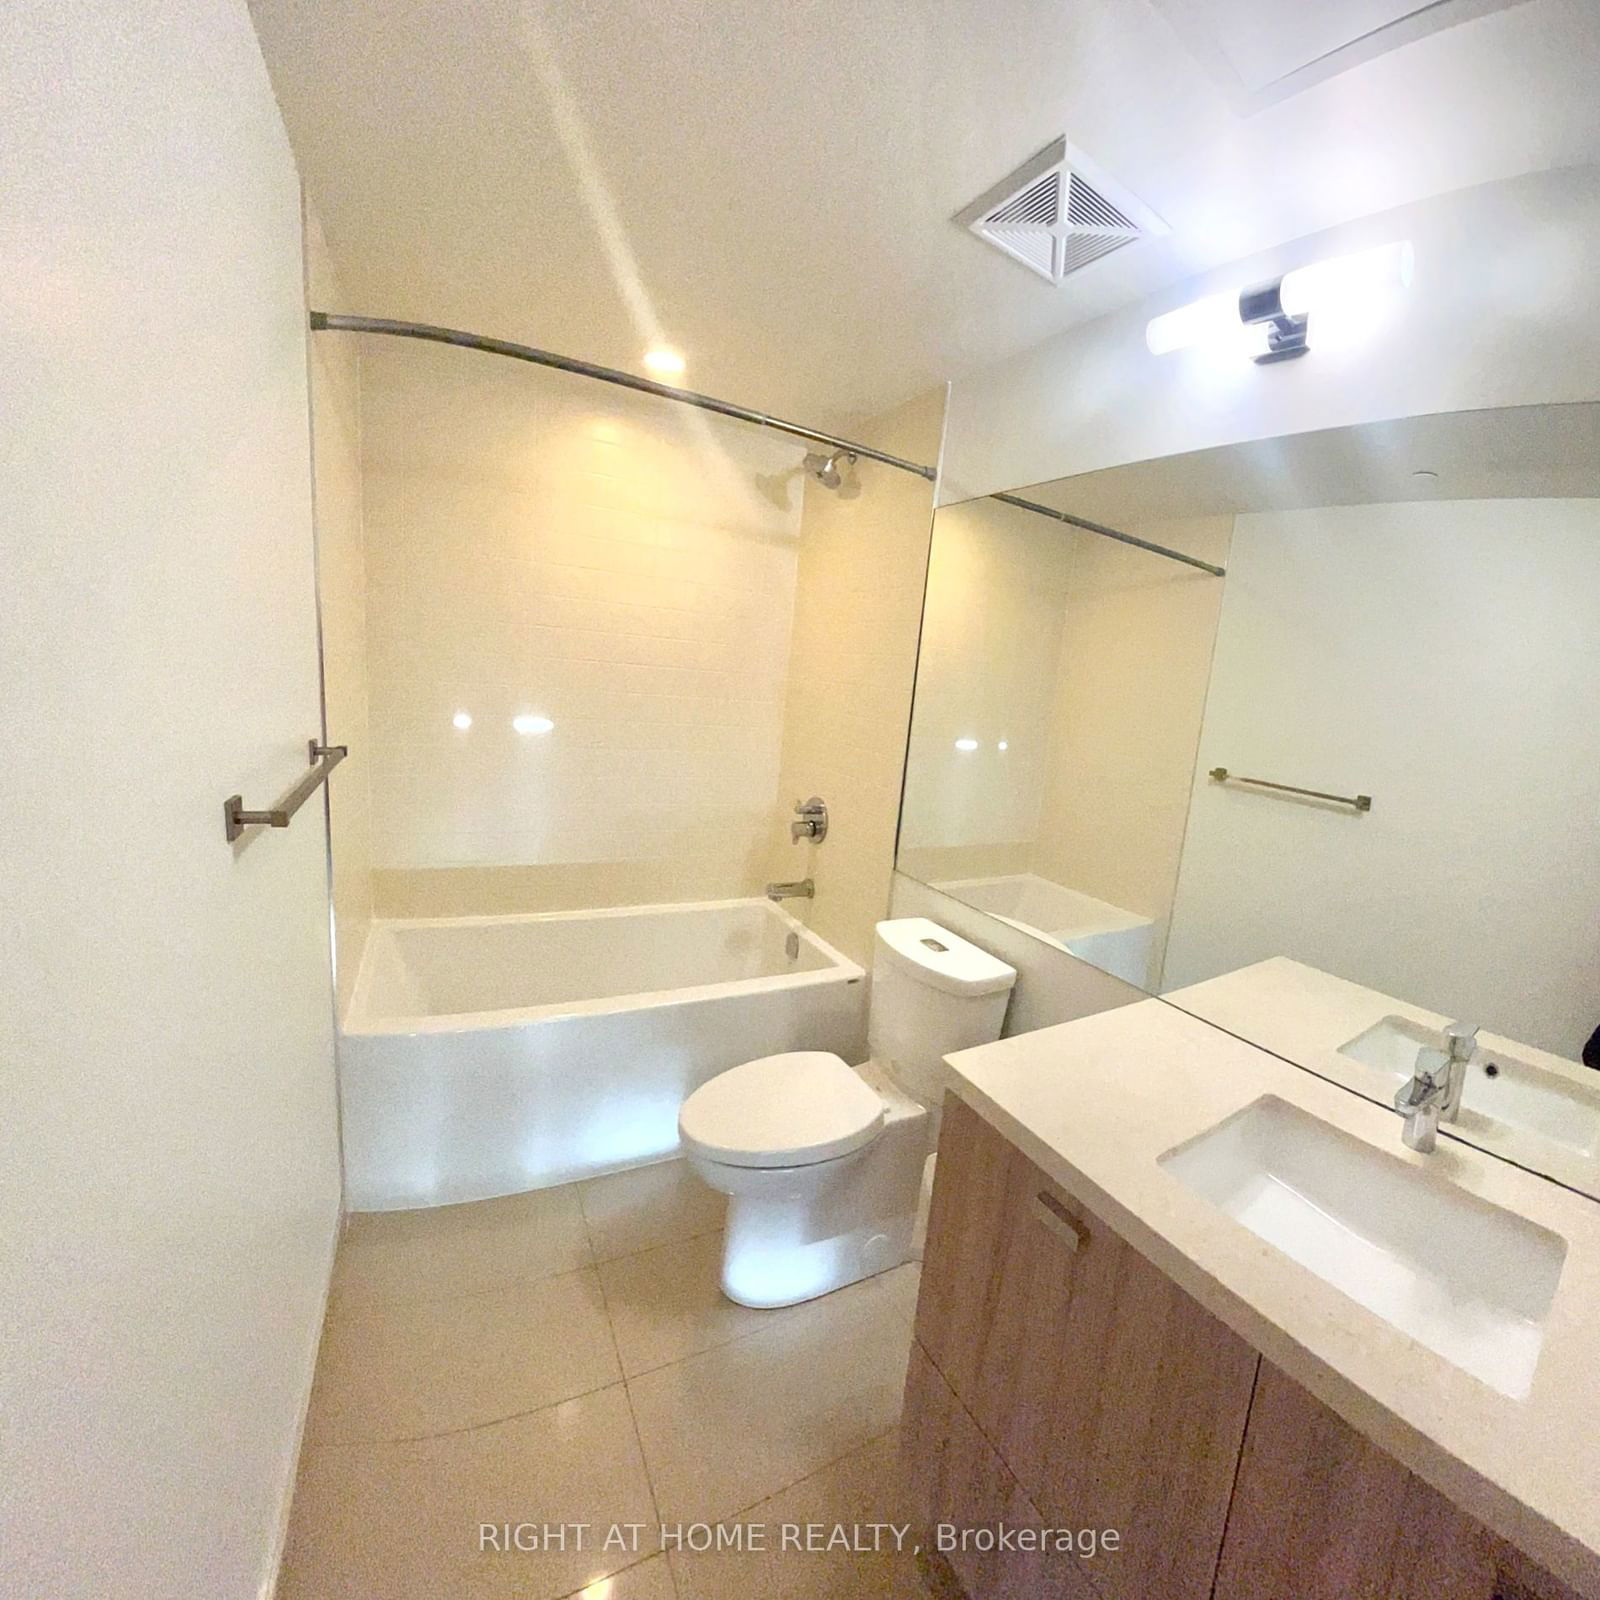
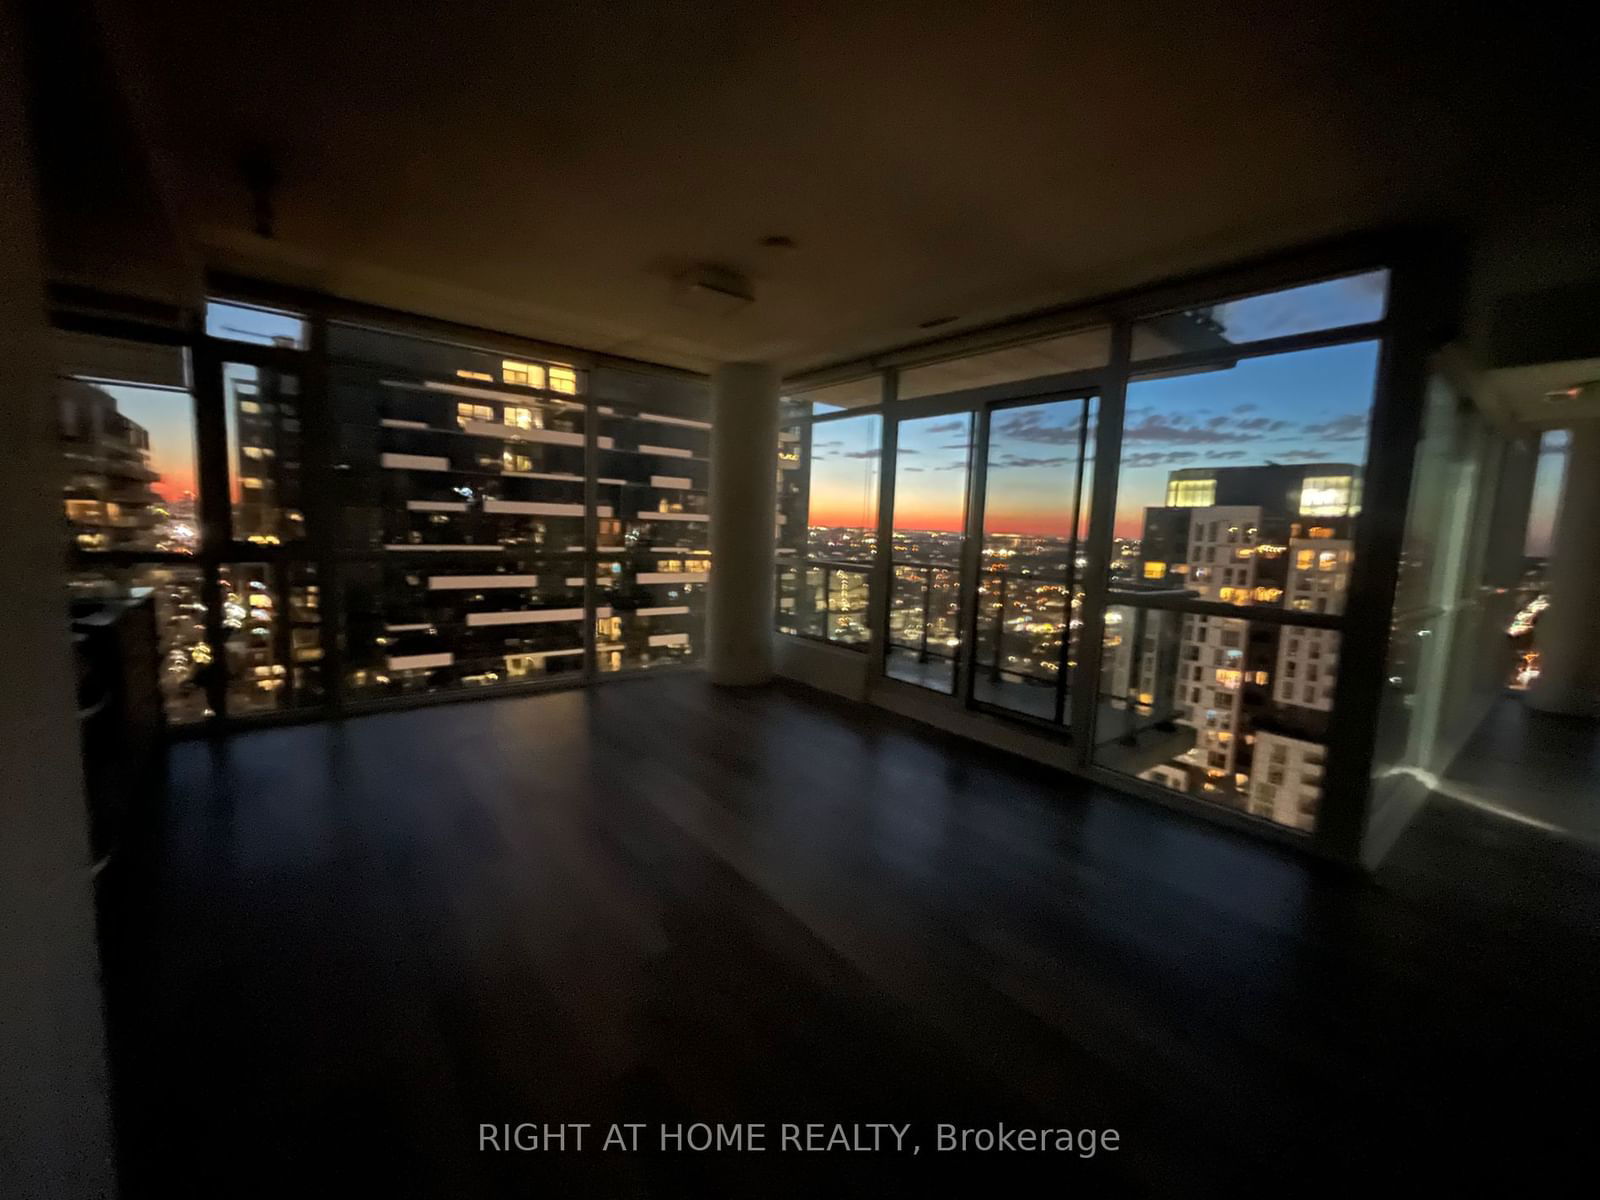
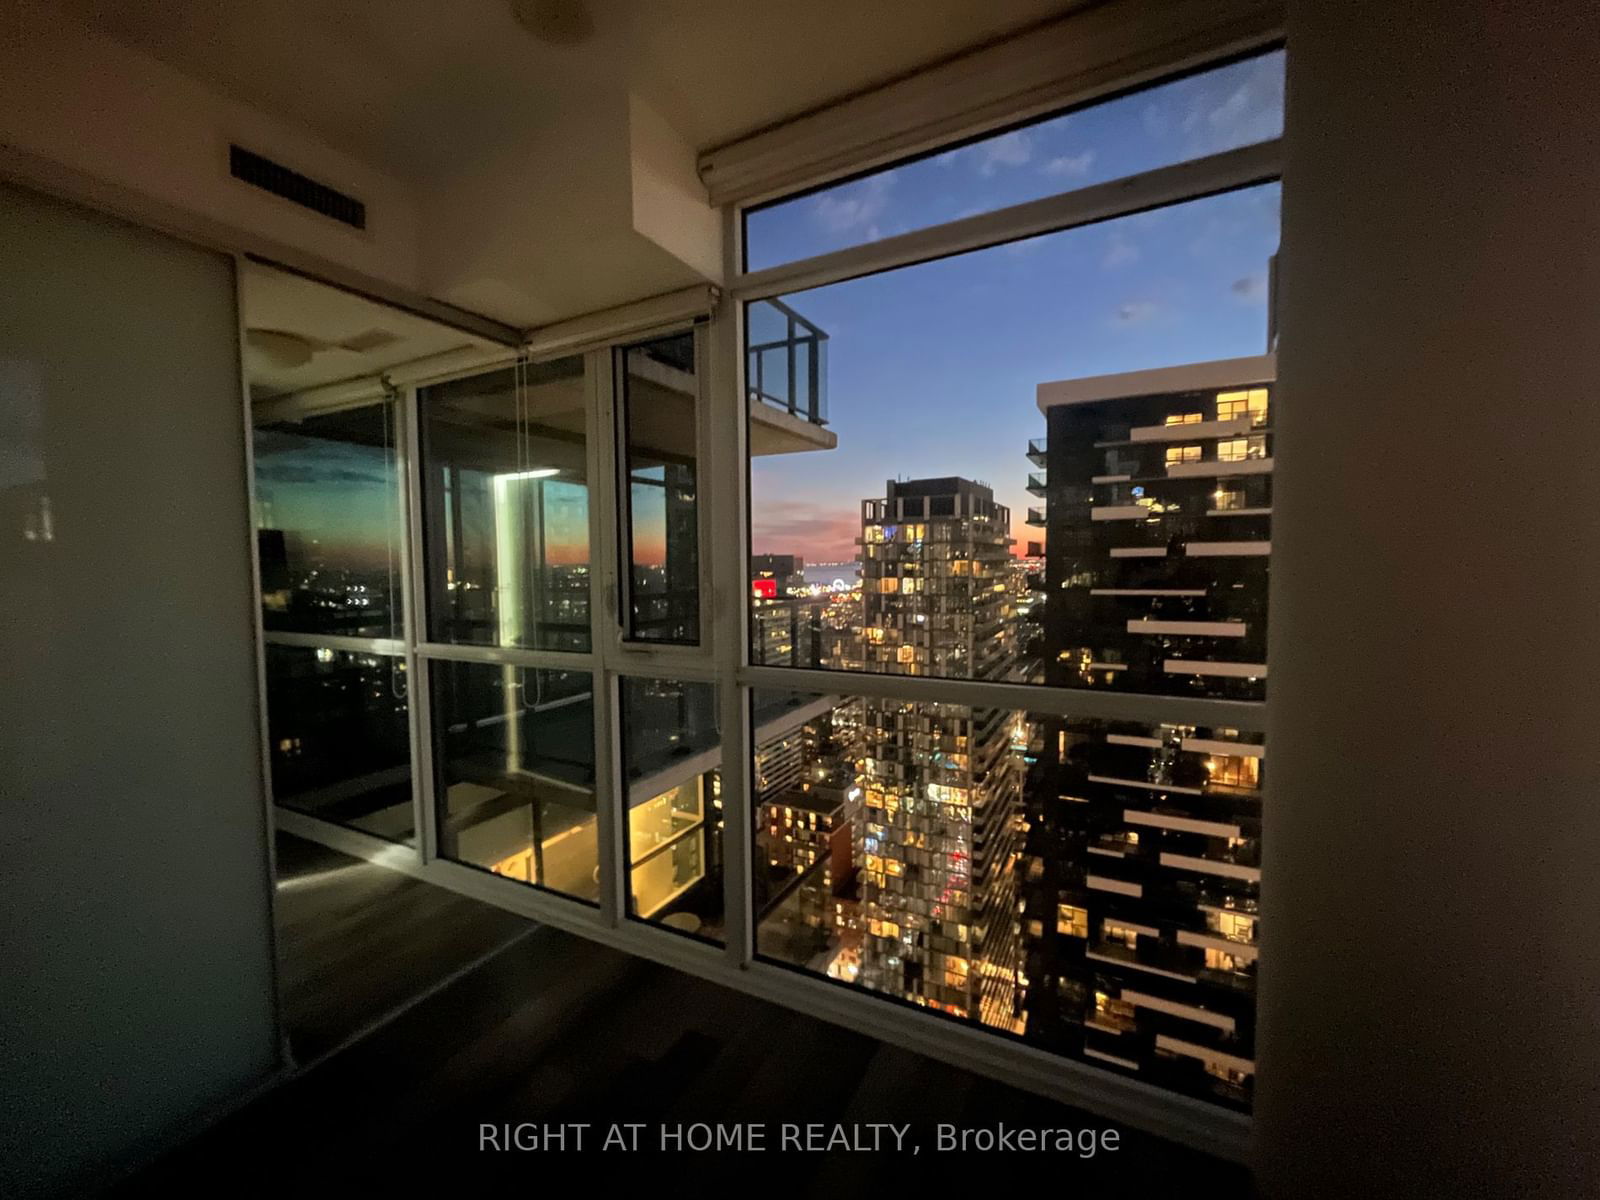
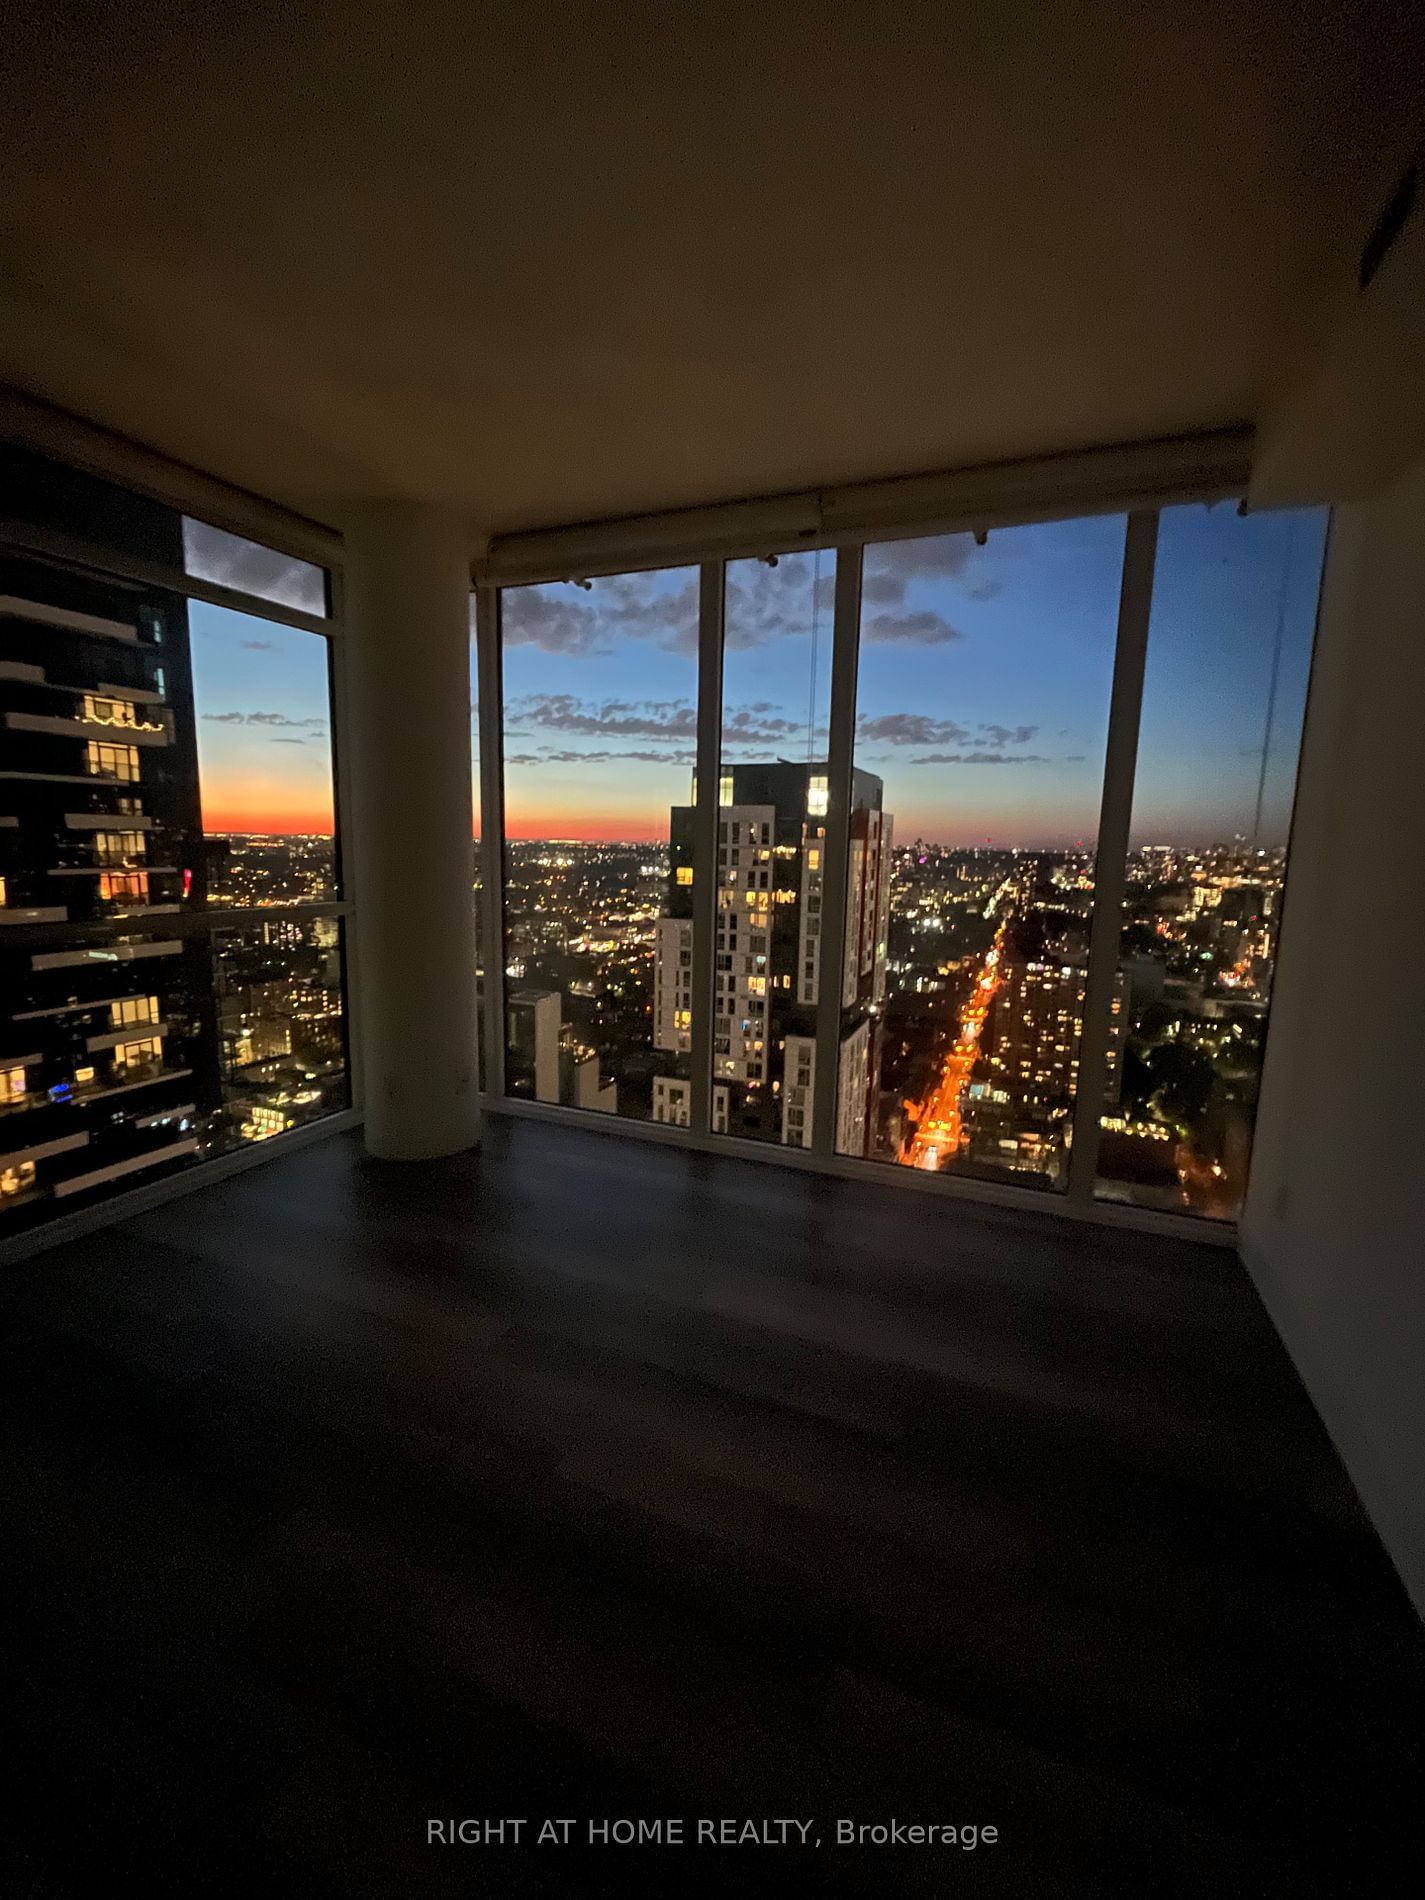
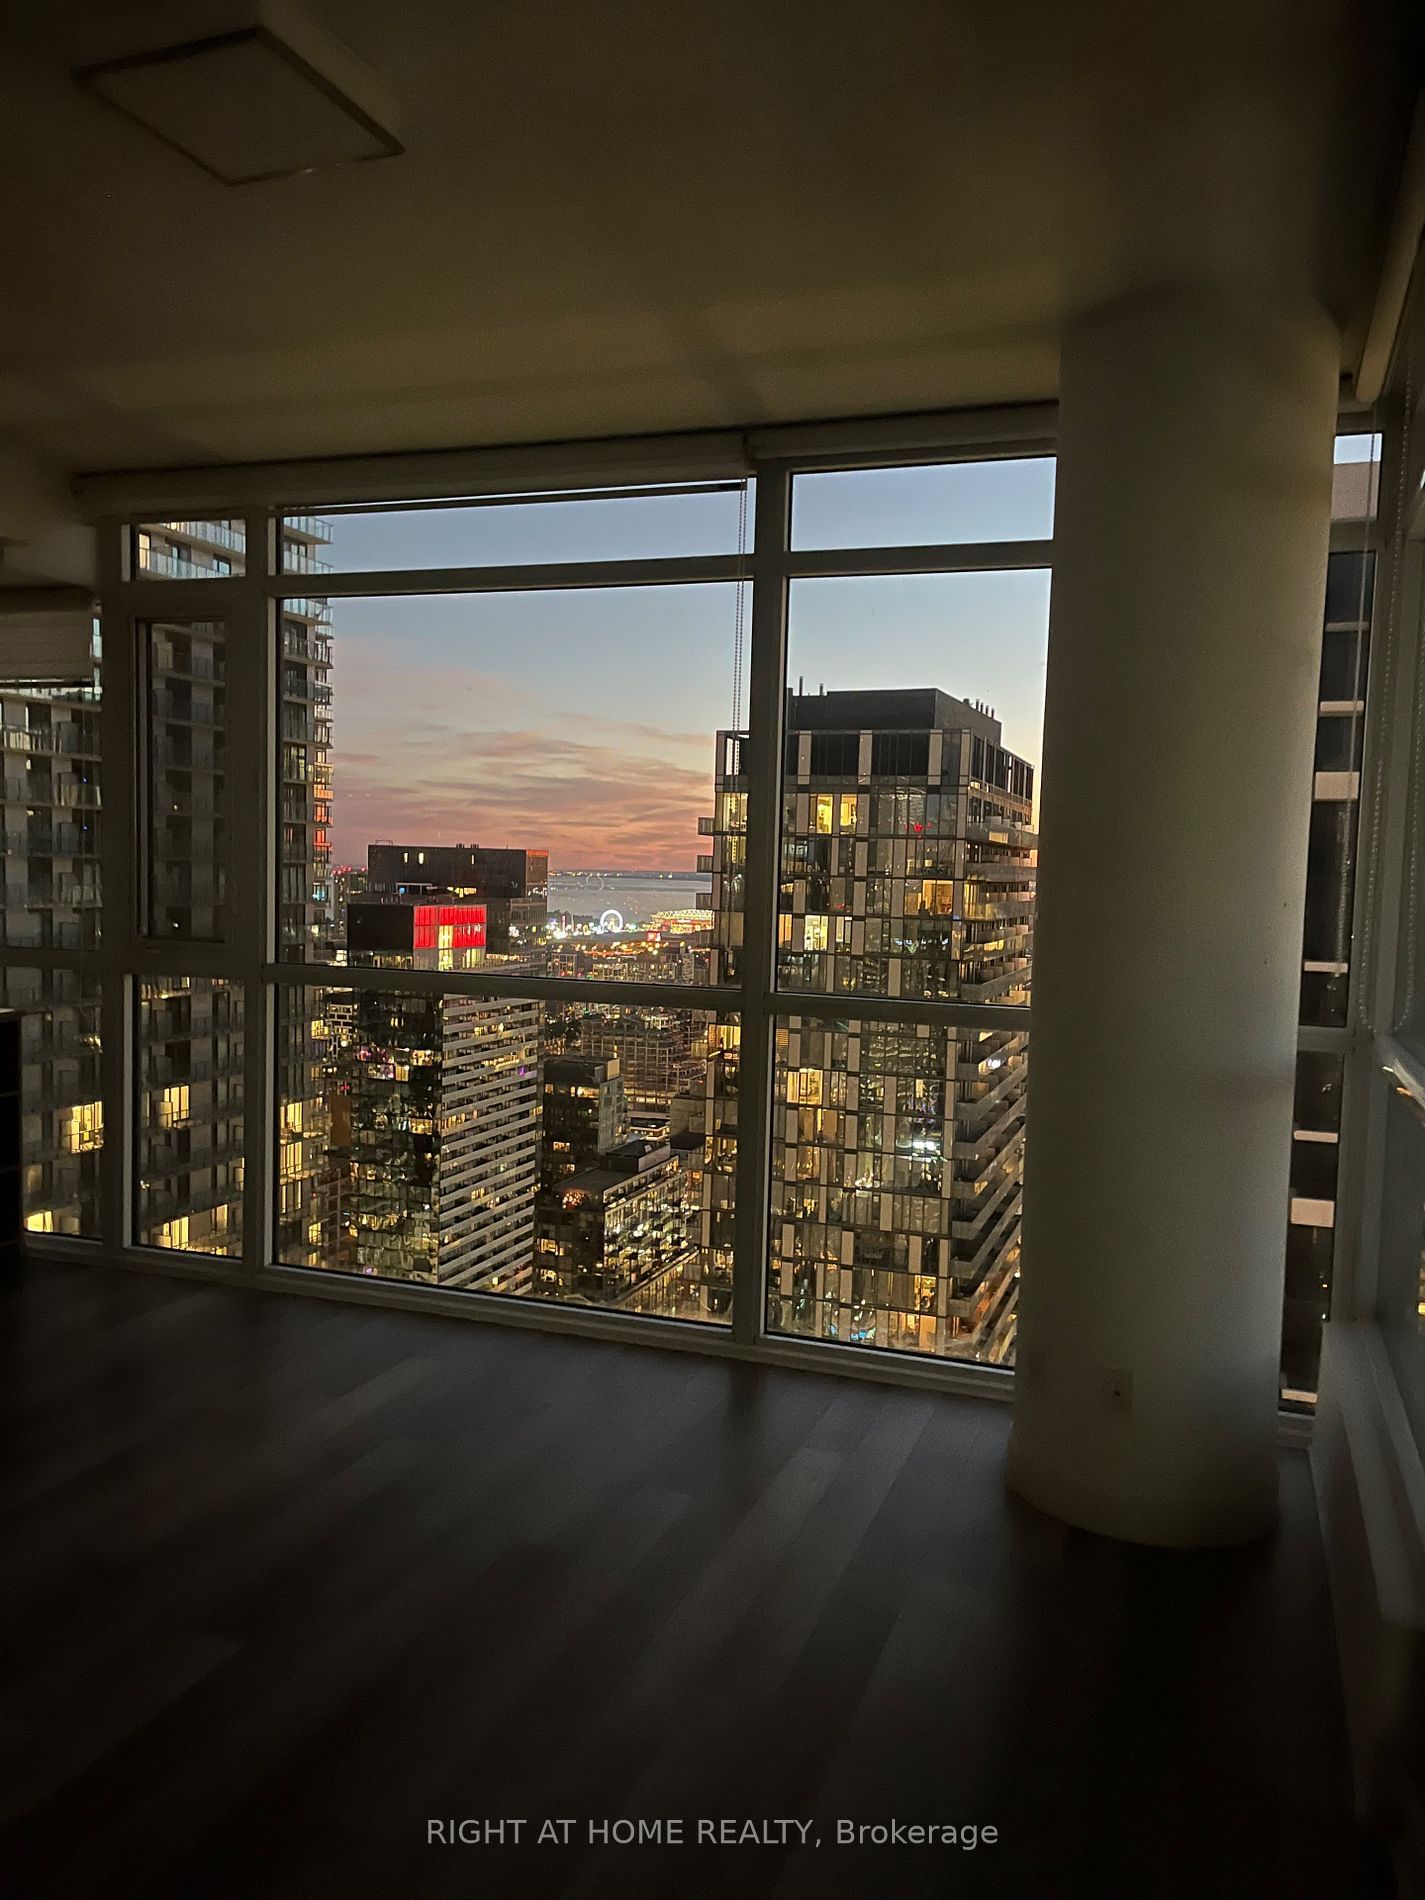
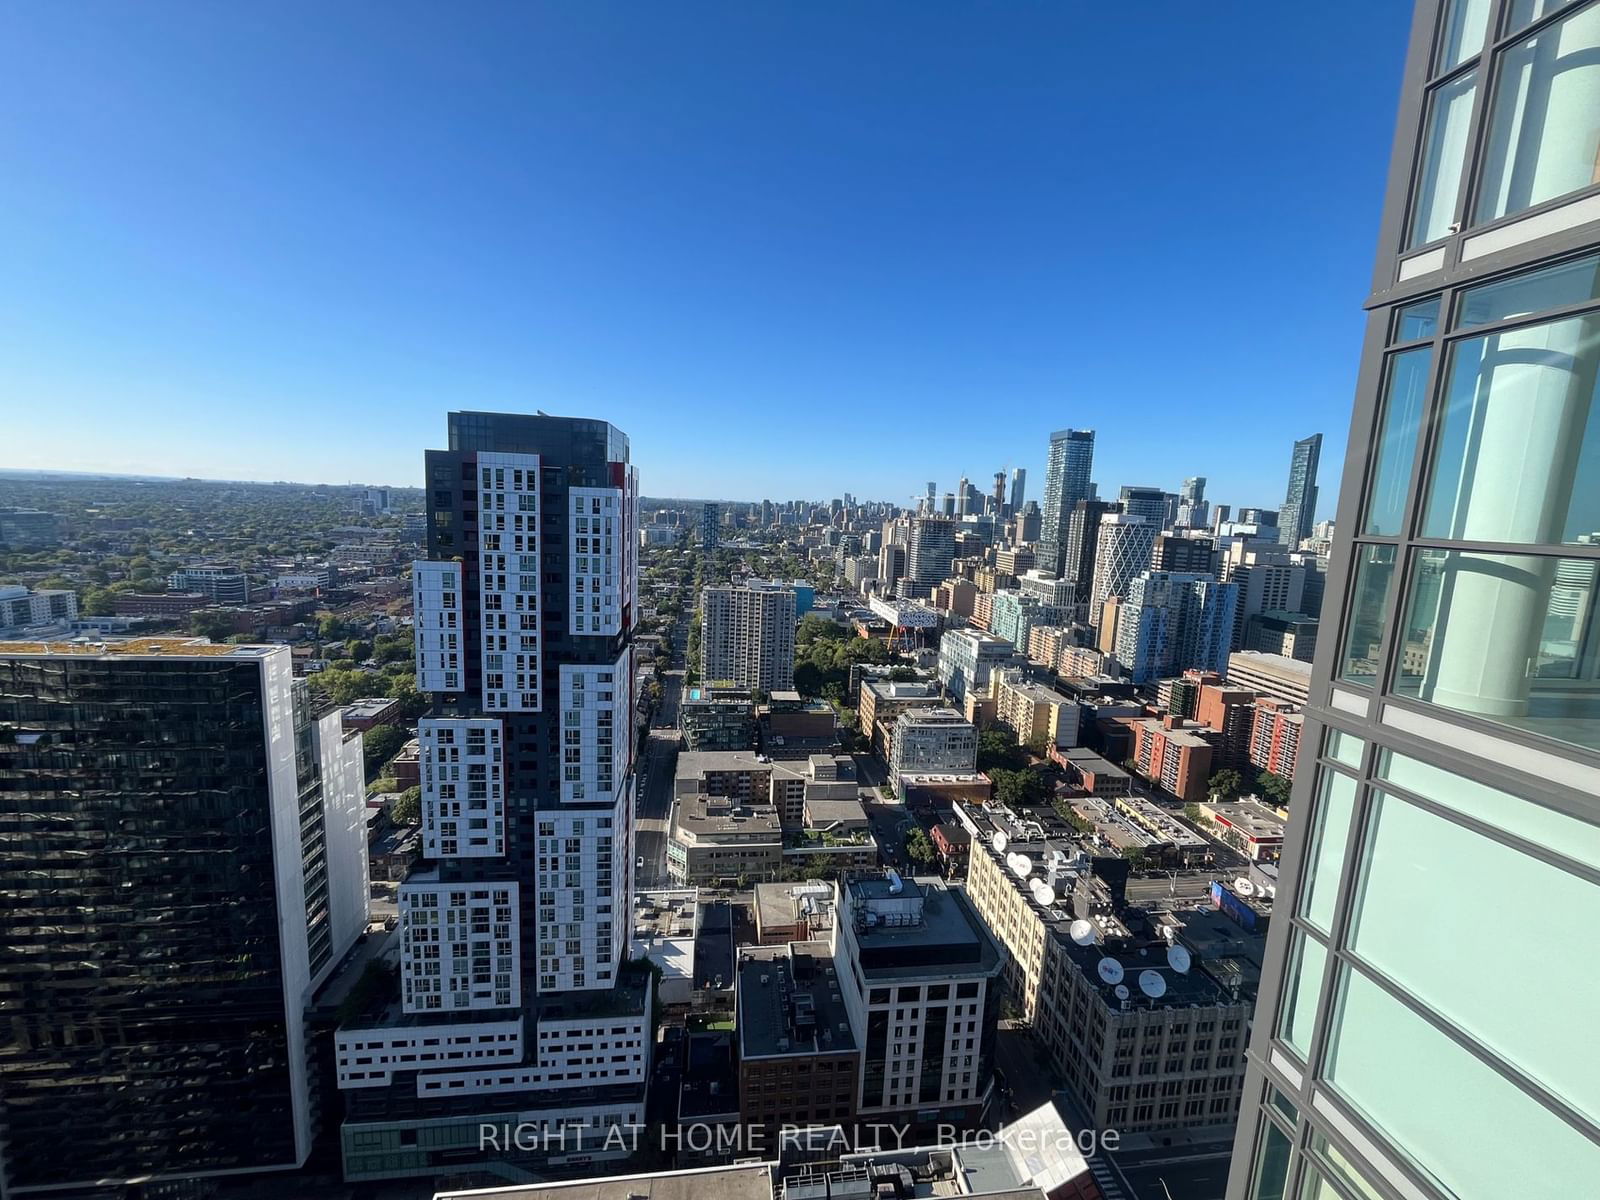
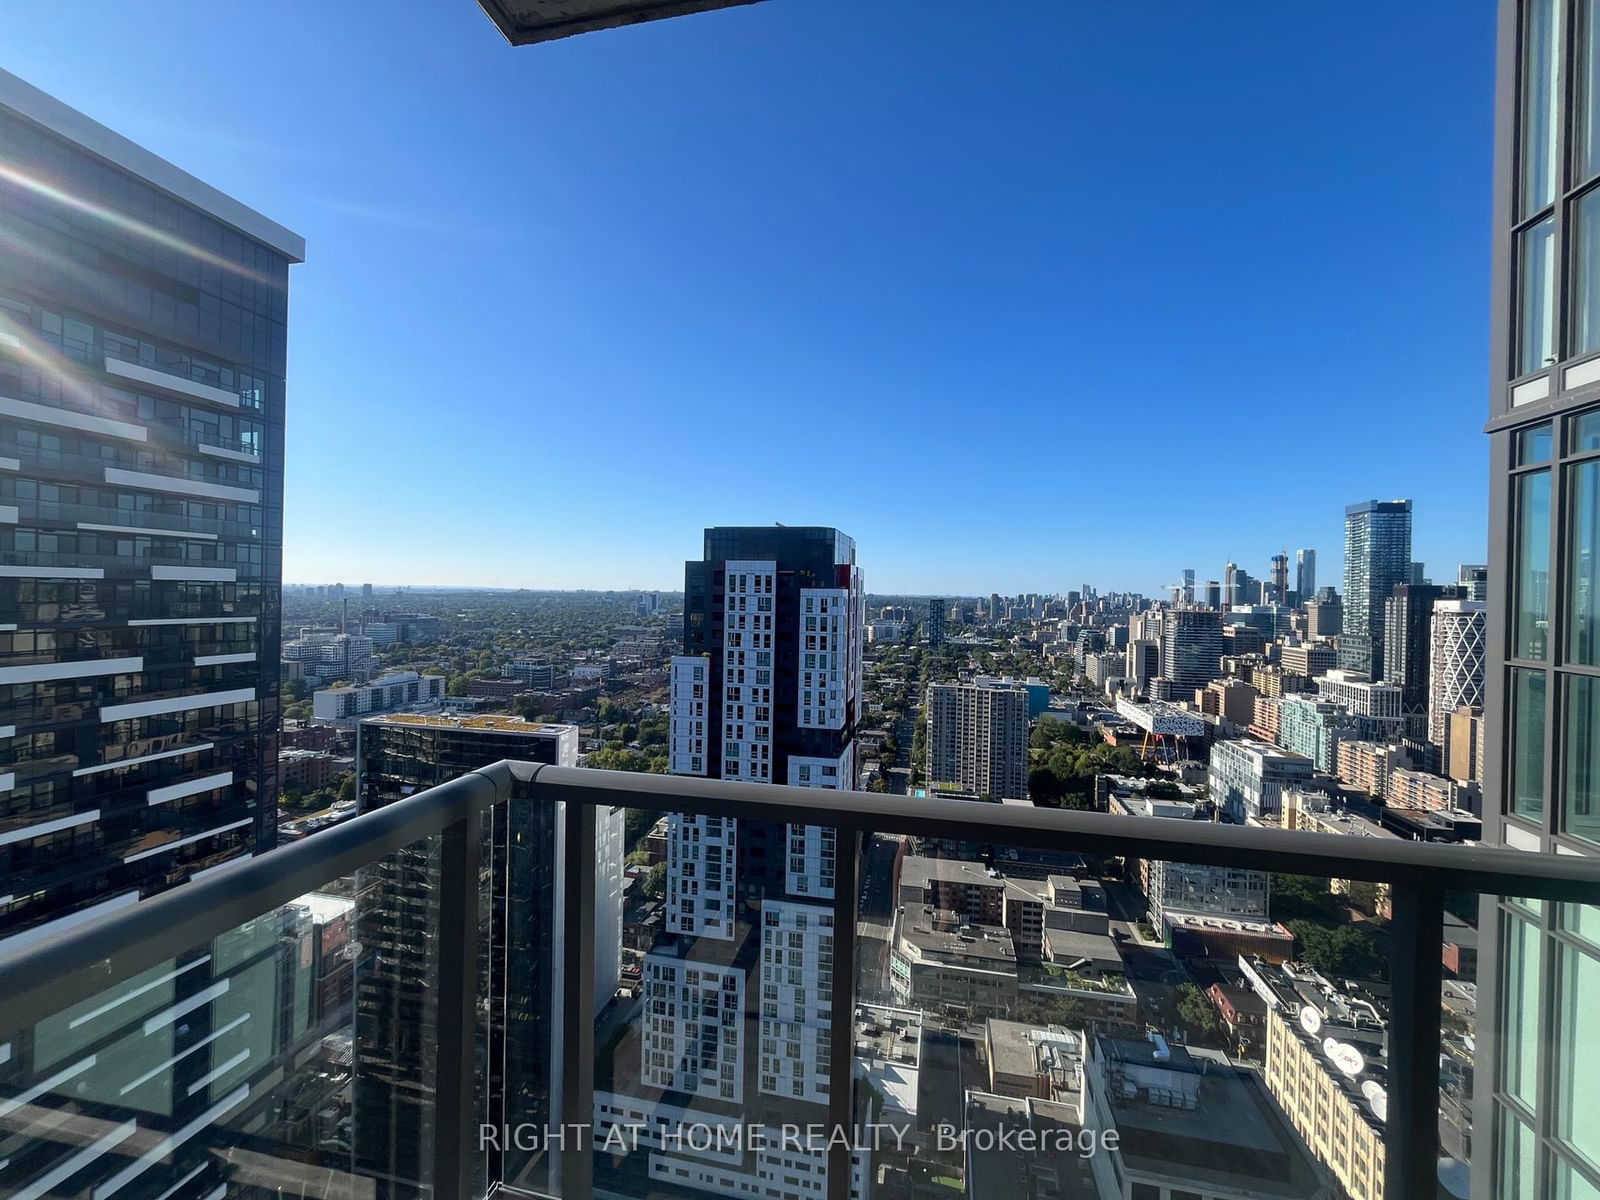
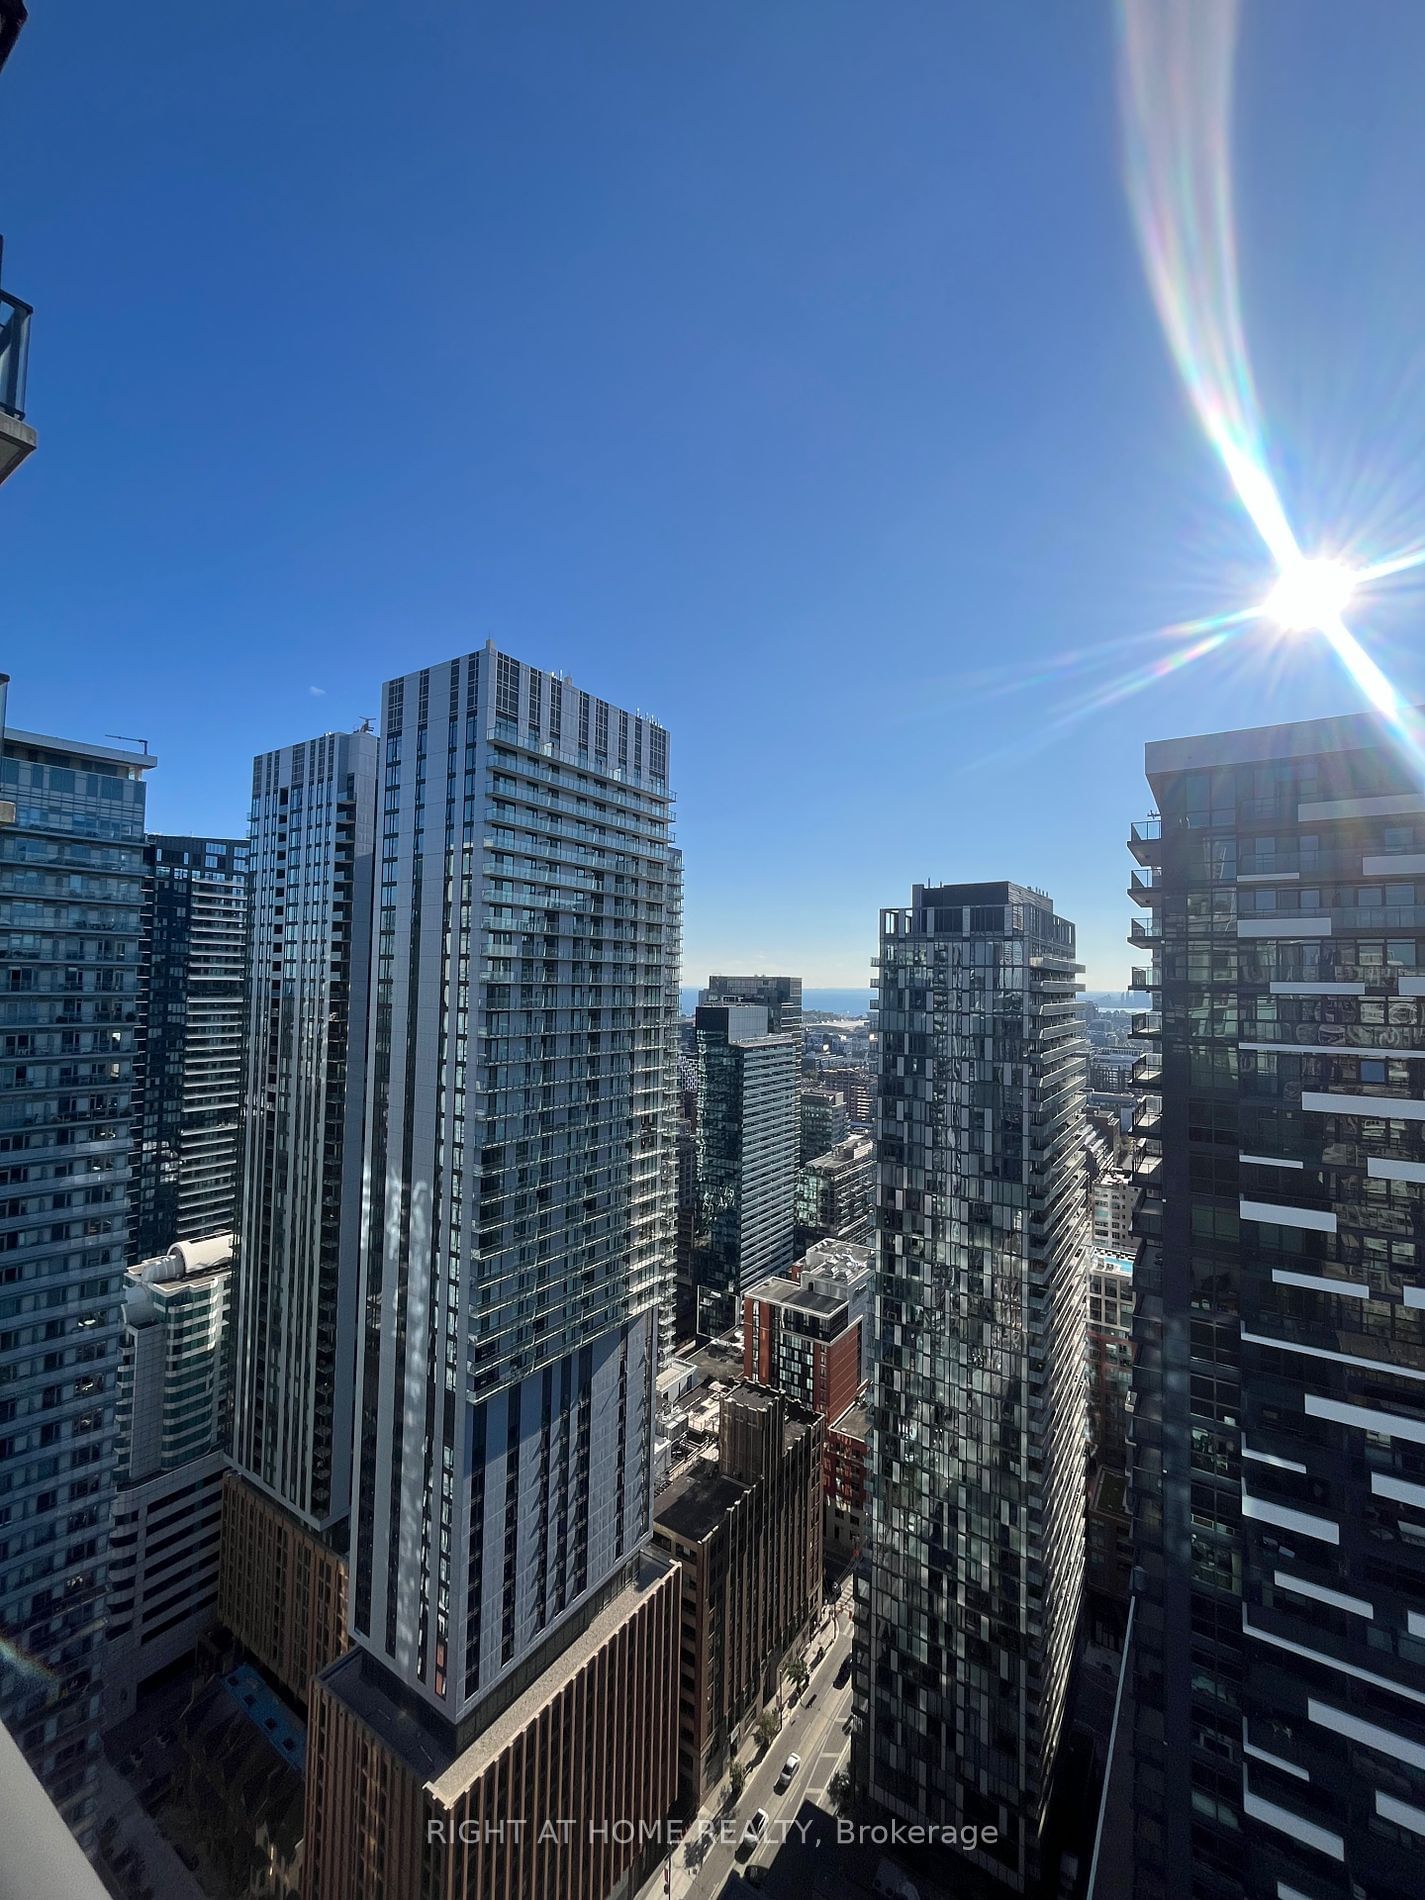
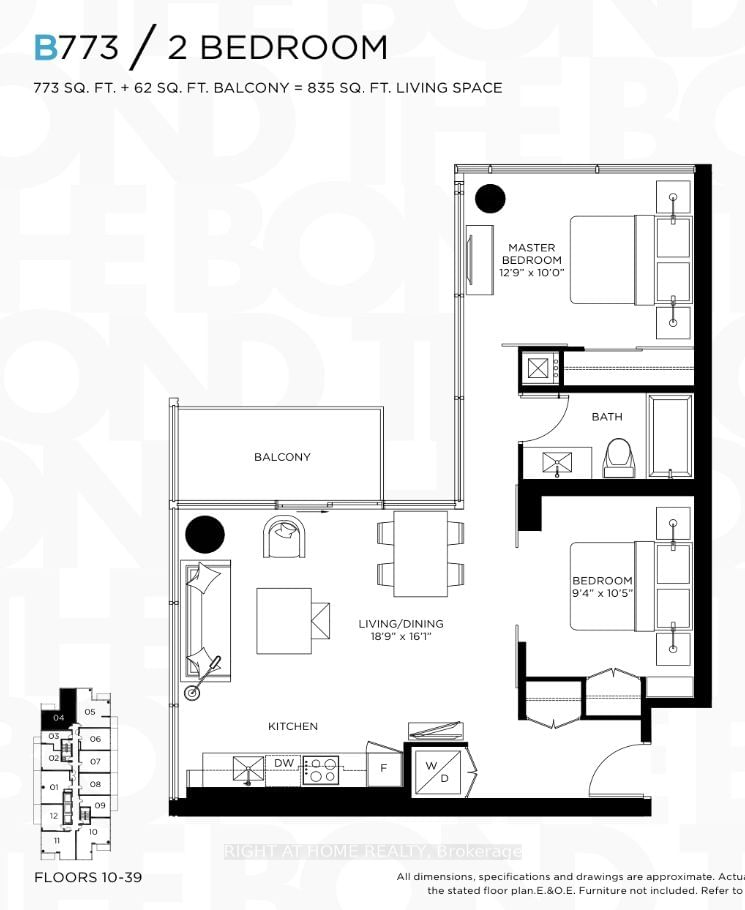
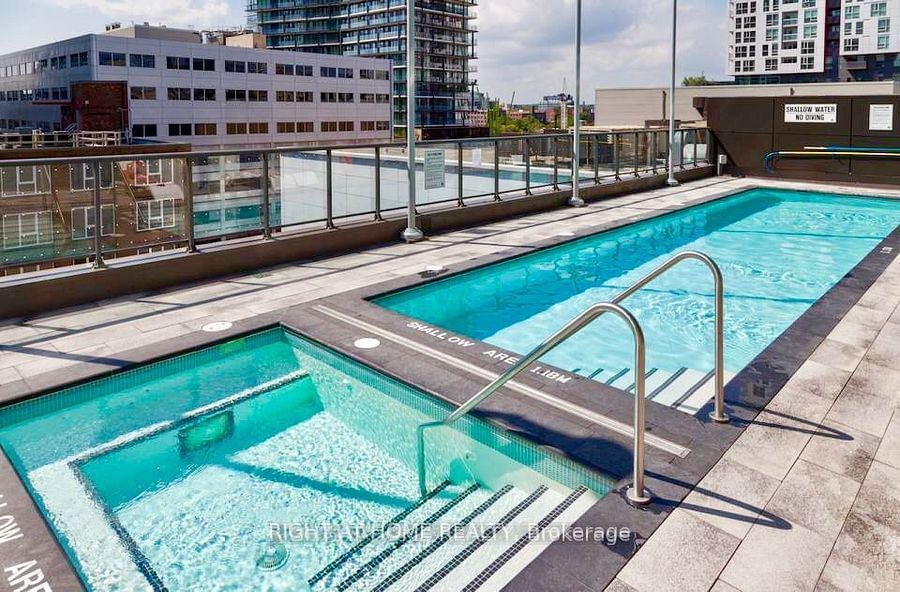
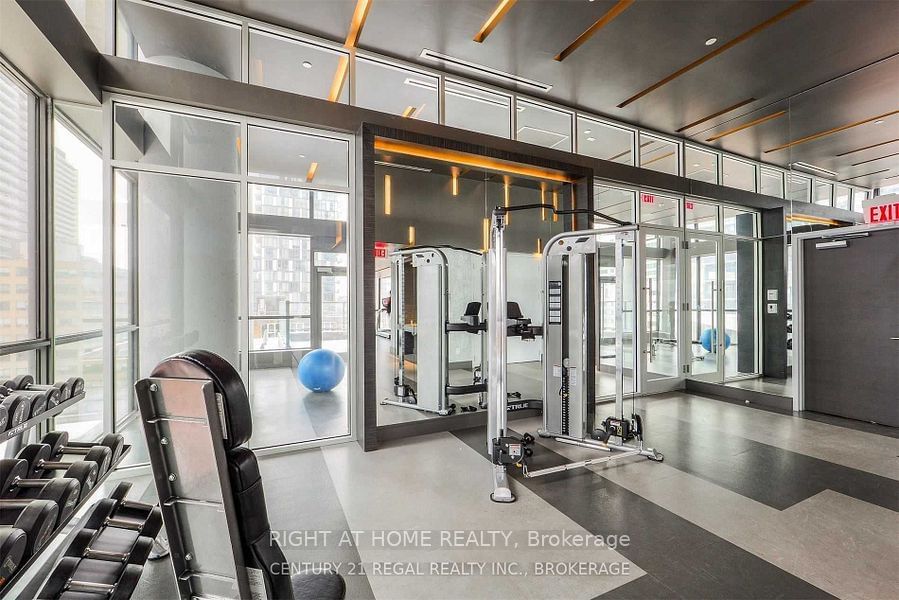
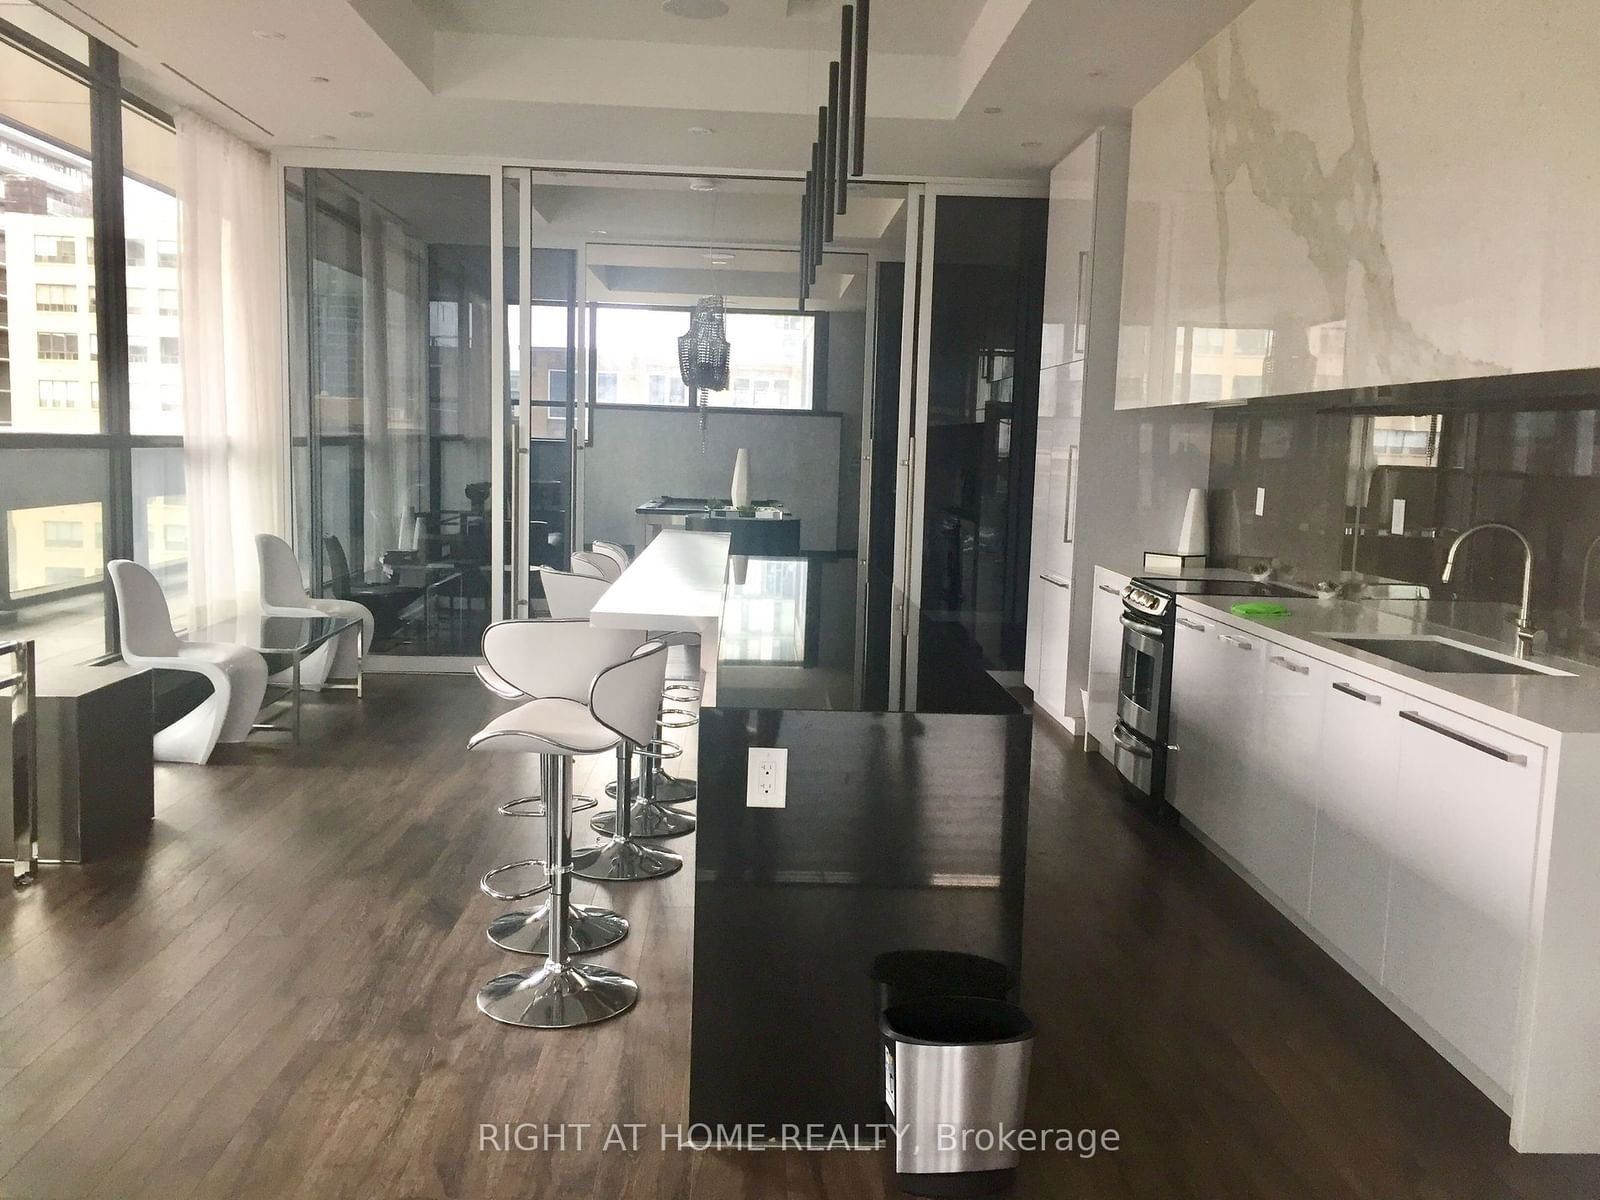
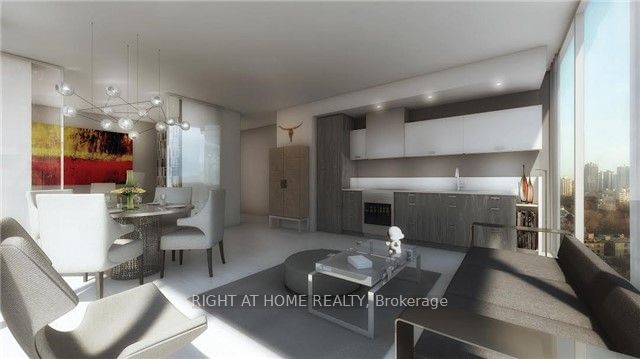
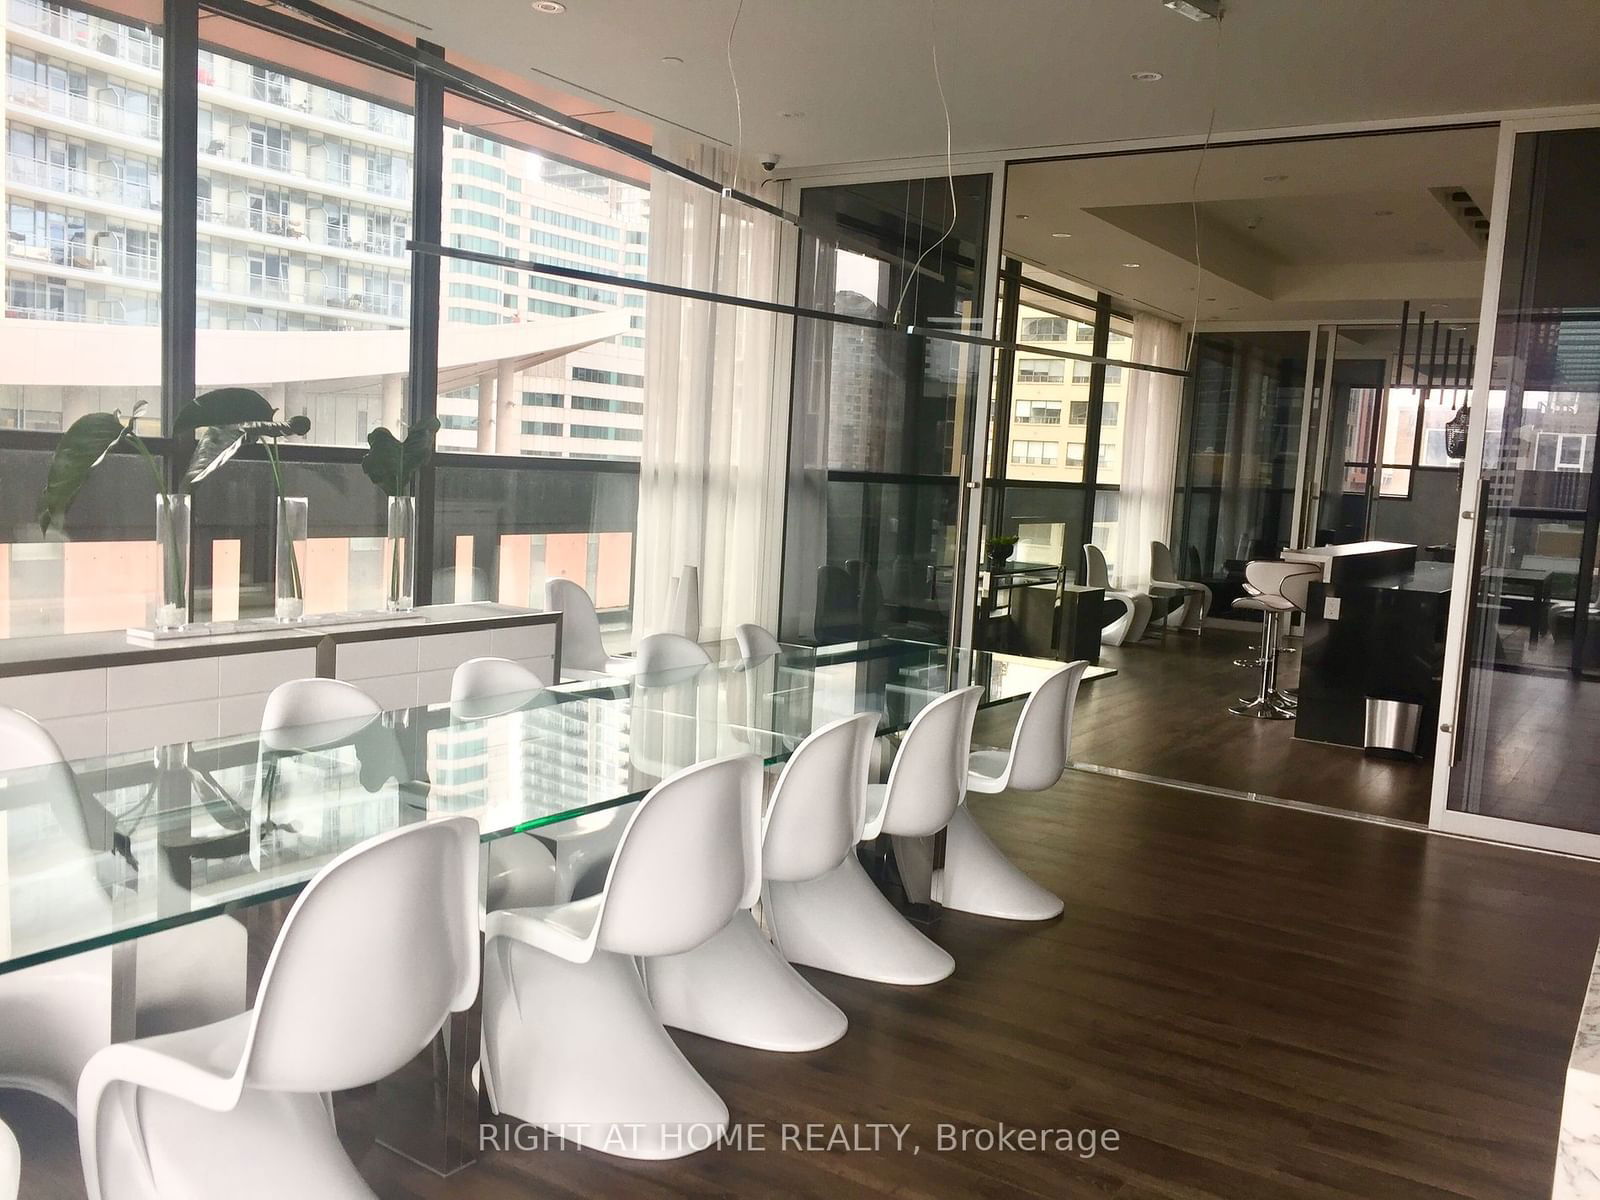
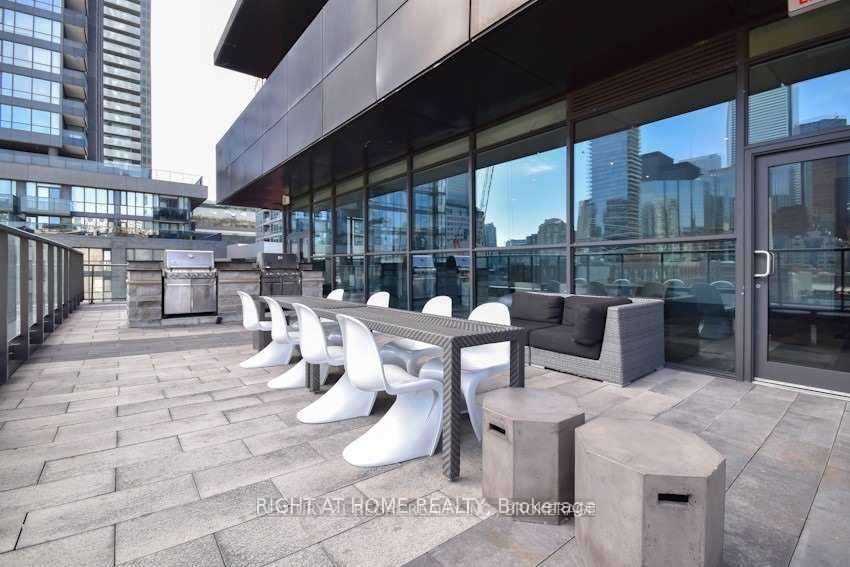
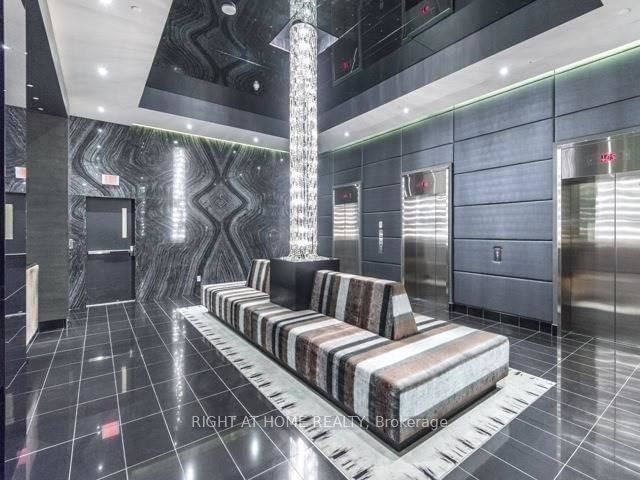
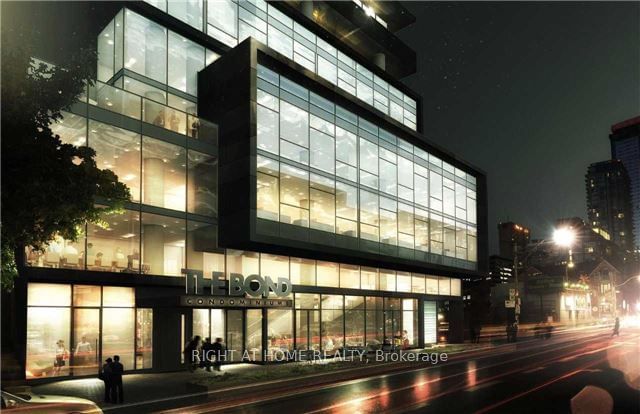
Exceptional Corner Unit with North West Exposure, Floor to Ceiling Windows with Incredible Light and Breath Taking Views Across the City, both Day and Night. This Corner Suite Features 2 Bedrooms +1 Bath and it has Been Freshly Painted Throughout. Located In The Ent. District At Adelaide/John the Suite Boasts with 835 Sq ft of Living space; 773 SQ FT+ 62 SQ FT.B. Laminate Floors, 10 Ft Ceilings, Floor To Ceiling Windows, Custom Zebra Blinds Built-In Kitchen Appliances, and Stone Counters. Heart Of Downtown Entertainment District, Shops, Restaurants, Luxurious Amenities Including: Outdoor Rooftop Pool & Fitness Retreat,24 Hr. Concierge, Large GymW/Yoga Studio, Hot Tub and Golf Simulator.
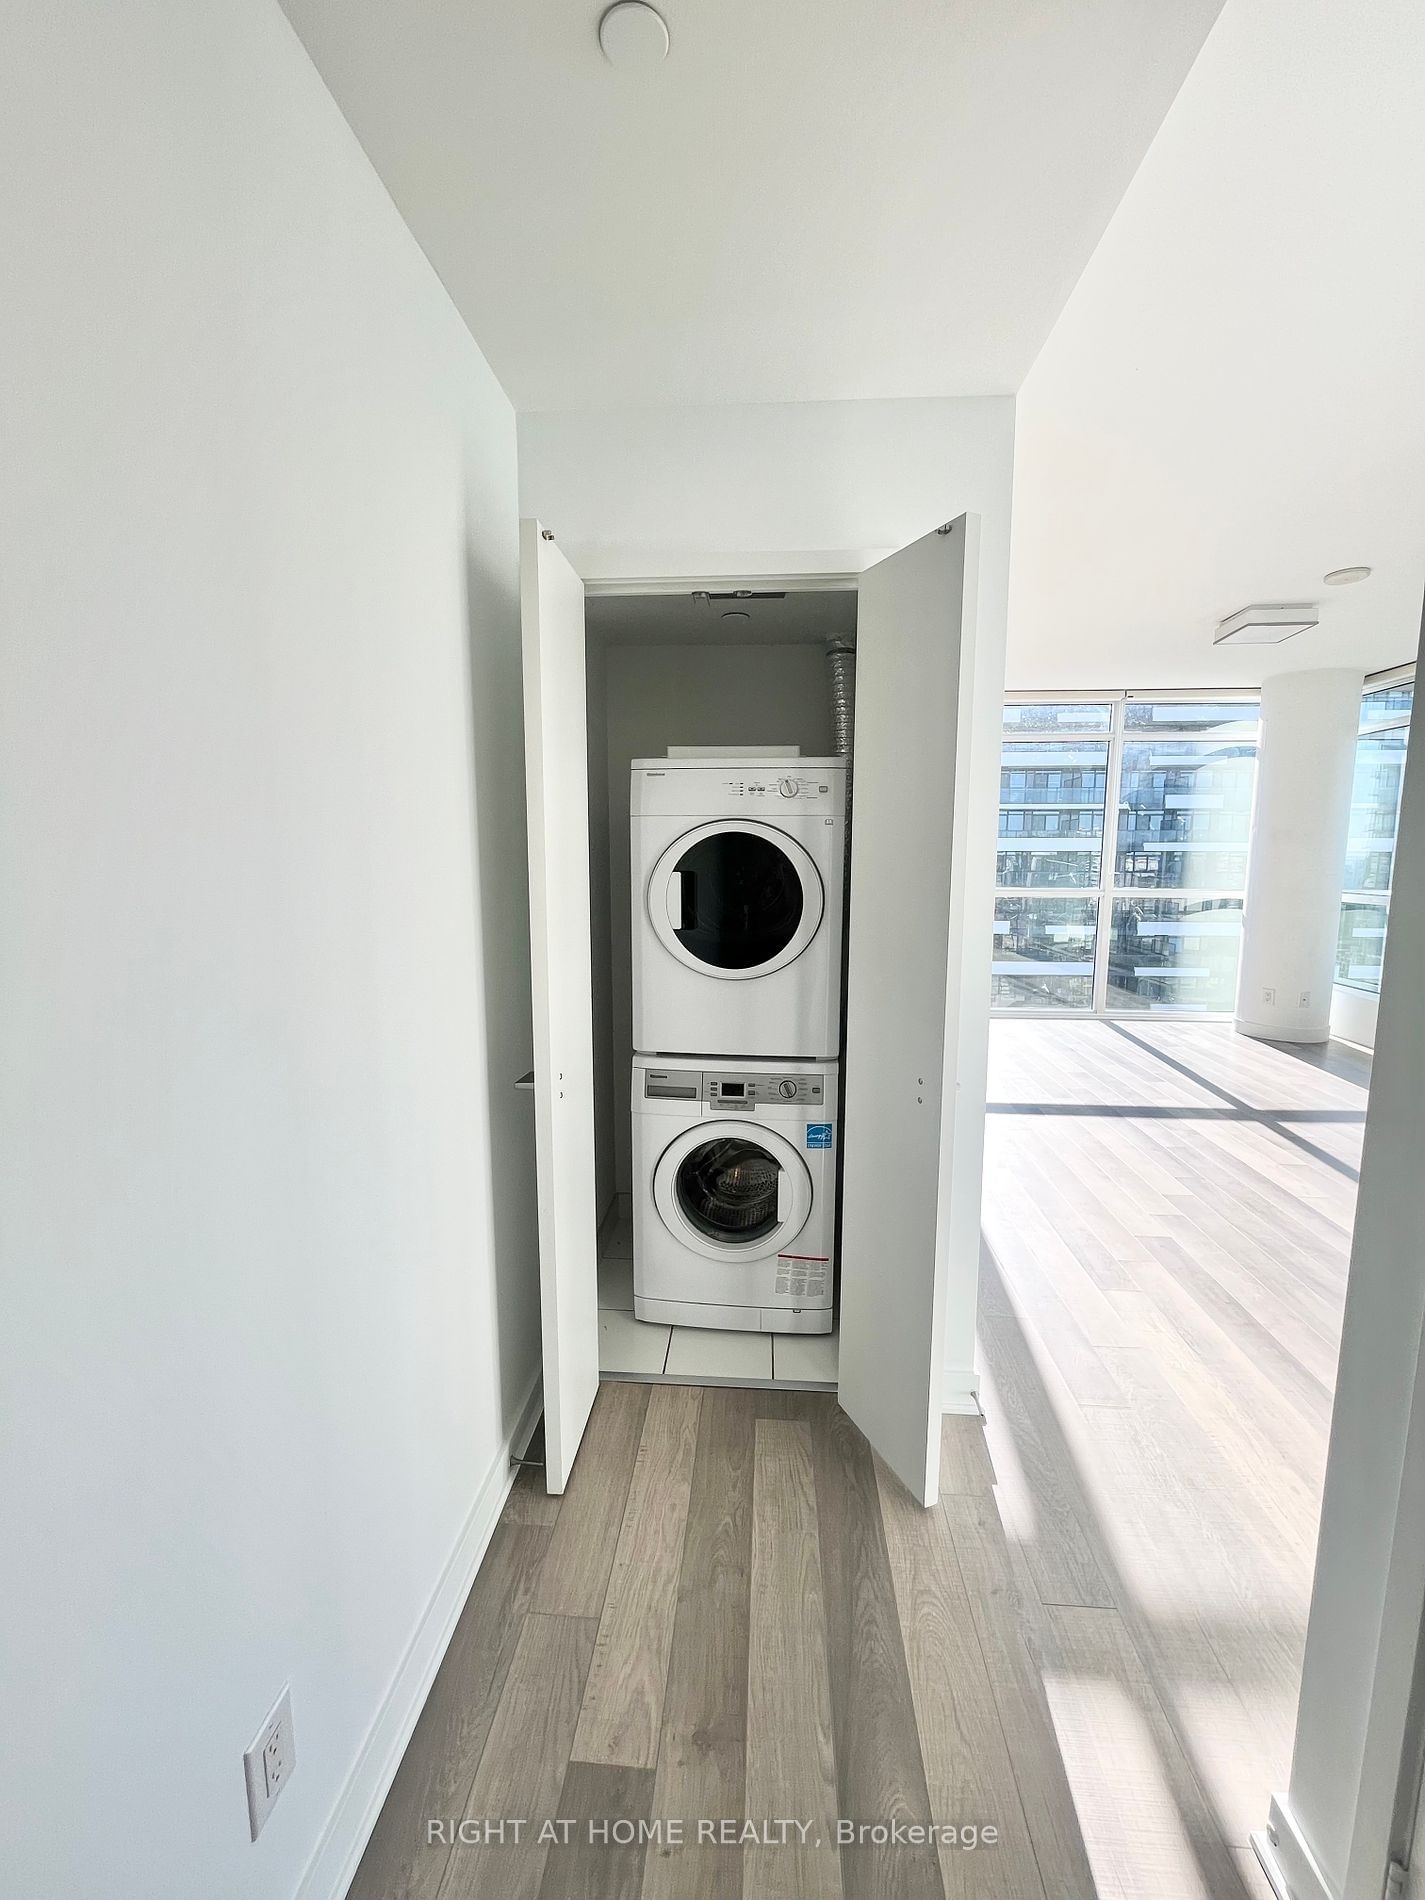
ExtrasBuilt In Fridge (2020), Stove, Microwave Range/Hood, Dishwasher (2022), Front Load Washer And Dryer. Laminate Floor And Custom Window BlindsThroughout.
right at home realtyMLS® #C9299893
Amenities
Explore Neighbourhood
Similar Listings
Demographics
Based on the dissemination area as defined by Statistics Canada. A dissemination area contains, on average, approximately 200 – 400 households.
Price Trends
Maintenance Fees
Building Trends At The Bond Condos
Days on Strata
List vs Selling Price
Offer Competition
Turnover of Units
Property Value
Price Ranking
Sold Units
Rented Units
Best Value Rank
Appreciation Rank
Rental Yield
High Demand
Transaction Insights at 290 Adelaide Street W
| Studio | 1 Bed | 1 Bed + Den | 2 Bed | 2 Bed + Den | 3 Bed | 3 Bed + Den | |
|---|---|---|---|---|---|---|---|
| Price Range | No Data | $520,000 - $559,900 | $625,000 - $758,000 | $742,000 - $880,000 | $975,000 | No Data | No Data |
| Avg. Cost Per Sqft | No Data | $1,297 | $1,207 | $1,124 | $1,100 | No Data | No Data |
| Price Range | $2,000 - $2,200 | $2,200 - $2,650 | $2,450 - $3,300 | $2,800 - $4,200 | $3,950 | $4,000 | No Data |
| Avg. Wait for Unit Availability | 140 Days | 55 Days | 57 Days | 54 Days | 344 Days | No Data | No Data |
| Avg. Wait for Unit Availability | 36 Days | 11 Days | 19 Days | 16 Days | 218 Days | 514 Days | No Data |
| Ratio of Units in Building | 9% | 35% | 23% | 30% | 4% | 2% | 1% |
Transactions vs Inventory
Total number of units listed and sold in Queen West

