


MLS Restricted Listing
Free account required. or to see all the details.
Free account required. or to see all the details.
1 / 17
Listing History
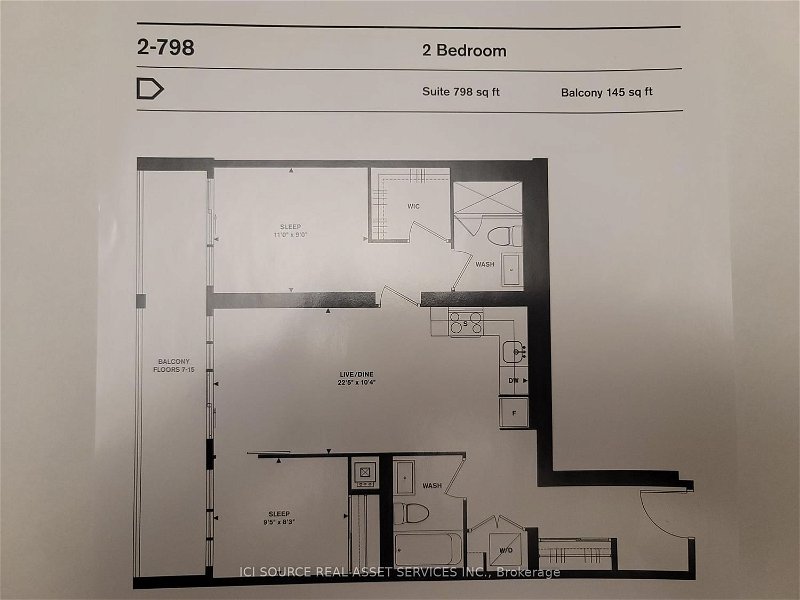
Unit Highlights
MLS Restricted Listing
Free account required. or to see all the details.
Free account required. or to see all the details.
Renter's Market
Balanced
Landlord's Market
Utilities Included
Rent Includes
Building Maintenance
Excluded
Hydro
Heat
Air Conditioning
Water
Unit Details
- Air Conditioning
- Central Air
- Heat Source
- Gas
- Heating
- Forced Air
- Ensuite Laundry
- Yes
Amenities
Rooftop Deck
Rec Room
Concierge
Gym Room
Media Room
Indoor Parking
Nearby Amenities
9/10
Walkability
One small step for you. One giant leap towards never needing a gym membership.
10/10
Transit
Meet the heartbeat of the city — transit so smooth, you’ll never miss a beat.
9/10
Bikeability
Pedal paradise! You might as well have wheels for feet.
Demographics
Based on the dissemination area as defined by Statistics Canada. A dissemination area contains, on average, approximately 200 – 400 households.
Population
11,959
Average Individual Income
$60,766
Average Household Size
3 persons
Average Age
44
Average Household Income
$102,581
Dominant Housing Type
High Rise Apartment
Population By Age
Household Income
Housing Types & Tenancy
High Rise Apartment
47%
Detached
33%
Semi Detached
10%
Duplex
5%
Low Rise Apartment
4%
Marital Status
Commute
Languages (Primary Language)
Other
74%
Mandarin
10%
Cantonese
9%
Arabic
2%
Tagalog
2%
Telugu
1%
Hindi
1%
Spanish
1%
Education
University and Above
40%
High School
23%
College
15%
None
14%
Apprenticeship
3%
University Below Batchelor
3%
Major Field of Study
Business Management
25%
Architecture & Engineering
22%
Health & Related Fields
11%
Math & Computer Sciences
10%
Social Sciences
9%
Physical Sciences
5%
Humanities
4%
Education
3%
Visual & Performing Arts
3%
Personal, Protective & Transportation Services
2%
Agriculture & Natural Resources
1%
Price Trends
Building Trends At Home Power + Adelaide Condos
Days on Strata
Units at Home Power + Adelaide Condos spend an average of
28
Days on Strata
based on recent sales
List vs Selling Price
On average, these condos sell for
100%
of the list price.
Or in other words, the
Or in other words, the
entire list price
Offer Competition
Condos in this building have an
AVERAGEchance of receiving
Multiple Offers
Turnover of Units
On average, each unit is owned for
N/A
Property Value
-6%
Decrease in property value within the past twelve months
Price Ranking
8th
Highest price per SQFT out of 14 condos in the Corktown area
Sold Units
31
Units were Sold over the past twelve months
Rented Units
107
Units were Rented over the past twelve months
Best Value Rank
Home Power + Adelaide Condos offers the best value out of 14 condos in the Corktown neighbourhood
?
Appreciation Rank
Home Power + Adelaide Condos has the highest ROI out of 14 condos in the Corktown neighbourhood
?
Rental Yield
Home Power + Adelaide Condos yields the highest rent prices out of 14 condos in the Corktown neighbourhood
?
High Demand
Home Power + Adelaide Condos is the most popular building out of 14 condos in the Corktown neighbourhood
?
Transaction Insights at 48 Power Street
| Studio | 1 Bed | 1 Bed + Den | 2 Bed | 2 Bed + Den | 3 Bed | 3 Bed + Den | |
|---|---|---|---|---|---|---|---|
| Price Range | No Data | $505,000 - $610,000 | $565,000 - $620,000 | $620,000 - $870,000 | $810,000 - $958,880 | $898,900 - $1,220,000 | No Data |
| Avg. Cost Per Sqft | No Data | $1,128 | $1,008 | $1,003 | $993 | $931 | No Data |
| Price Range | No Data | $2,050 - $2,450 | $2,100 - $2,700 | $2,500 - $3,800 | $2,900 - $5,300 | $3,600 - $4,500 | $3,250 - $4,600 |
| Avg. Wait for Unit Availability | No Data | 62 Days | 120 Days | 42 Days | 108 Days | 99 Days | No Data |
| Avg. Wait for Unit Availability | No Data | 12 Days | 8 Days | 6 Days | 17 Days | 40 Days | 70 Days |
| Ratio of Units in Building | 1% | 15% | 23% | 39% | 14% | 8% | 3% |
Maintenance Fees
Home Power + Adelaide Condos vs The Corktown Area
