


1808 - 99 Broadway Avenue
Listing History
Unit Highlights
Utilities Included
Unit Details
- Air Conditioning
- Central Air
- Heat Source
- Gas
- Heating
- Forced Air
- Ensuite Laundry
- No
Room Dimensions
About this Listing
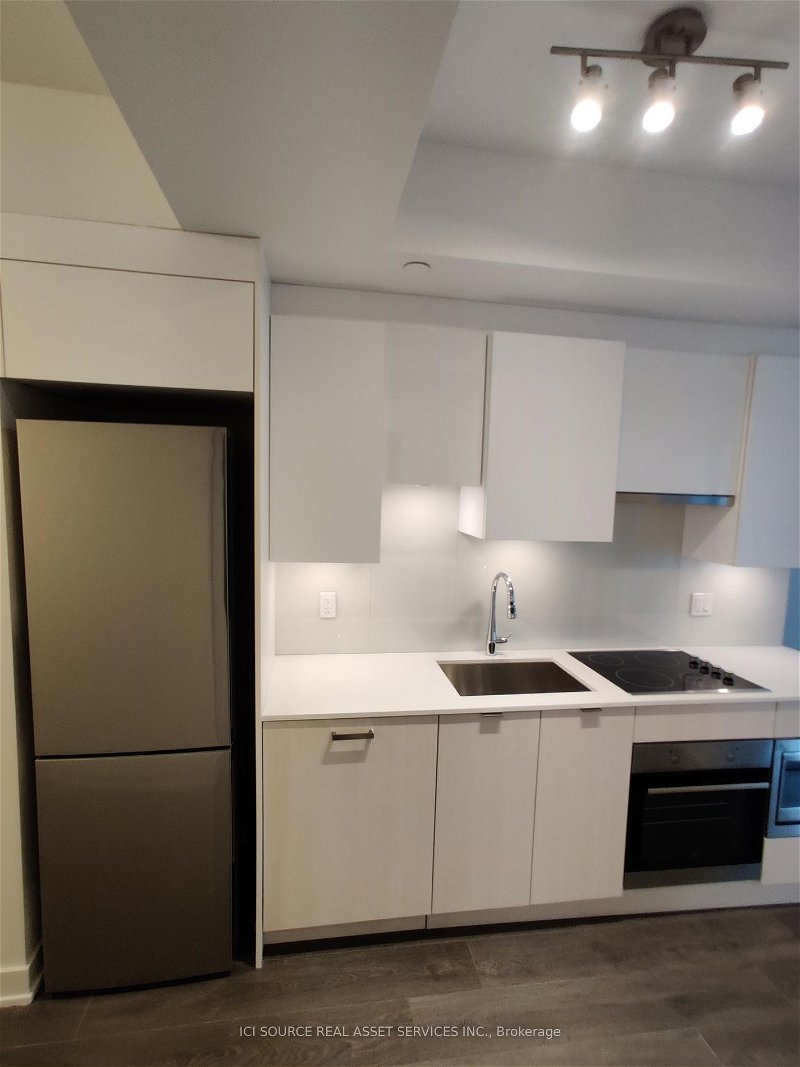
Yonge & Eglinton area, City lights On Broadway North Tower with Walking Distance To Subway, Restaurants, Shops & More! Citylights Offers Over 18,000 S.F. Of Indoor & Over 10,000 S.F. Of Outdoor Amenities Including 2 Pools,Amphitheater, Party Room W/ Chef's Kitchen, Fitness Centre & More! This Bright Unit Features 1 Bed, 1Bath With An Amazing Layout, Large Windows W/ Blinds Installed, Walk Out To Large Balcony W/ South Exposure. Ensuite Laundry. Shows A++- Wide Plank Laminate Floors, B/I S/S Kitchen Appliances Inc Fridge, Wall Oven, Microwave, Range Hood, Cooktop, Stone Counter-Top, Wash/Dryer, Quartz Window Sills Available from April 01, 2024, Pls note, these one bedroom units does not come with parking. Need Job Letter, Credit Report and reference from current landlord
Extras*For Additional Property Details Click The Brochure Icon Below*
ici source real asset services inc.MLS® #C8197020
Amenities
Nearby Amenities
Demographics
Based on the dissemination area as defined by Statistics Canada. A dissemination area contains, on average, approximately 200 – 400 households.
Price Trends
Building Trends At CityLights on Broadway
Days on Strata
List vs Selling Price
Offer Competition
Turnover of Units
Property Value
Price Ranking
Sold Units
Rented Units
Best Value Rank
Appreciation Rank
Rental Yield
High Demand
Transaction Insights at 99 Broadway Avenue
| Studio | 1 Bed | 1 Bed + Den | 2 Bed | 2 Bed + Den | 3 Bed | 3 Bed + Den | |
|---|---|---|---|---|---|---|---|
| Price Range | $415,000 - $480,000 | $458,000 - $555,000 | $510,000 - $690,000 | $650,000 - $900,000 | $865,000 - $925,000 | No Data | No Data |
| Avg. Cost Per Sqft | $1,173 | $1,149 | $1,079 | $1,075 | $887 | No Data | No Data |
| Price Range | $1,900 - $2,280 | $2,100 - $3,225 | $2,100 - $2,800 | $2,190 - $3,650 | $4,000 | No Data | No Data |
| Avg. Wait for Unit Availability | 137 Days | 45 Days | 49 Days | 49 Days | 518 Days | No Data | No Data |
| Avg. Wait for Unit Availability | 14 Days | 4 Days | 4 Days | 5 Days | 121 Days | No Data | No Data |
| Ratio of Units in Building | 11% | 30% | 31% | 28% | 2% | 1% | 1% |
