


1 / 11
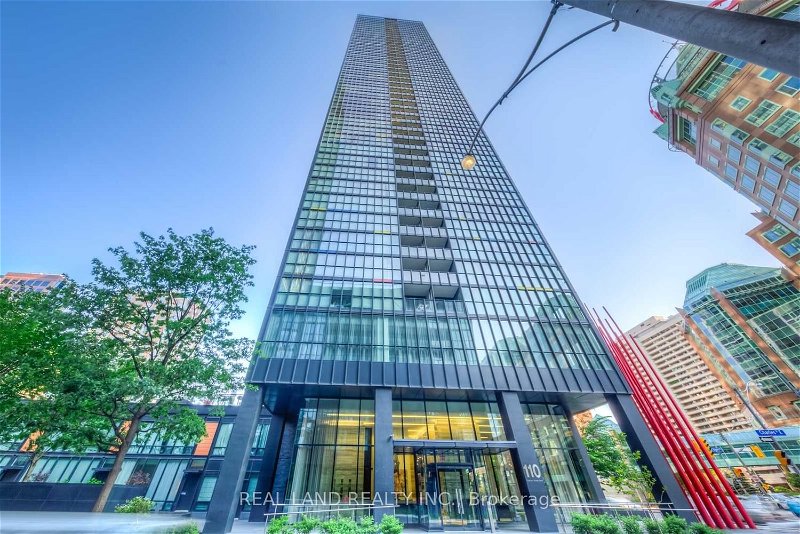
4005 - 110 Charles Street E
Listing History
Unit Highlights
Property Type:
Condo
Cost Per Sqft:
$1,093/sqft
Maintenance Fees:
$682/mth
Taxes:
$3,505 (2023)
Locker:
Owned
Outdoor Space:
Balcony
Exposure:
North West
Possession Date:
X days
Buyer's Market
Balanced
Seller's Market
Maintenance Fees
Included
Heat
Air Conditioning
Water
Parking
Building Maintenance
Building Insurance
Excluded
Hydro
Unit Details
- Air Conditioning
- Central Air
- Heat Source
- Gas
- Heating
- Other
- Ensuite Laundry
- Yes
Room Dimensions
Living
Window Flr To Ceil, O/Looks Living, Built-in Desk
13.12 x 11.75ft
Kitchen
Modern Kitchen, Centre Island, Combined with Dining
16.08 x 11.75ft
Bedroom
4 Piece Ensuite, Double Closet, Sliding Doors
23.62 x 9.25ft
About this Listing
Bright & Modern unit, Corner unit W/Floor To Ceiling Windows. Breathtaking View Of City Skyline *Gorgeous modern Kitchen W/Center Island, B/I Cabinet, Granite Backsplash & Counters,Custom Uv Blinds, Split2 Bedroom / 2 Bath Plan For Maximum Privacy. 24Hr Concierge *Friendly Staff *World Class FacilitiesIncludes Lounge & Outdoor Pool, Gym, Party Rm, Guest Suite & Visitor Parking, 24 hours Notice for appointment
real land realty inc.MLS® #C8104166
Amenities
Visitor Parking
Rooftop Deck
Concierge
Indoor Pool
Gym Room
Media Room
Nearby Amenities
9/10
Walkability
Congratulations, you're the mayor of Walksville! Everything's at your doorstep.
9/10
Transit
So frequent, you might accidentally start collecting tickets.
7/10
Bikeability
Your bike's the trusty steed in this urban jungle — giddy up!
Demographics
Based on the dissemination area as defined by Statistics Canada. A dissemination area contains, on average, approximately 200 – 400 households.
Population
18,370
Average Individual Income
$65,640
Average Household Size
3 persons
Average Age
45
Average Household Income
$108,336
Dominant Housing Type
Detached
Population By Age
Household Income
Housing Types & Tenancy
Detached
42%
Semi Detached
20%
High Rise Apartment
18%
Low Rise Apartment
12%
Duplex
5%
Marital Status
Commute
Languages (Primary Language)
English
58%
Mandarin
13%
Cantonese
12%
Other
12%
Tagalog
2%
Tamil
2%
Spanish
1%
Education
University and Above
32%
High School
26%
College
17%
None
17%
Apprenticeship
3%
University Below Batchelor
3%
Major Field of Study
Business Management
26%
Architecture & Engineering
18%
Health & Related Fields
12%
Social Sciences
12%
Math & Computer Sciences
8%
Physical Sciences
5%
Humanities
4%
Education
4%
Personal, Protective & Transportation Services
3%
Visual & Performing Arts
3%
Price Trends
Building Trends At X Condos
Days on Strata
Units at X Condos spend an average of
32
Days on Strata
based on recent sales
List vs Selling Price
On average, these condos sell for
1%
below
the list price.
Offer Competition
Condos in this building have an
AVERAGEchance of receiving
Multiple Offers
Turnover of Units
On average, each unit is owned for
6.4
YEARS before being sold againProperty Value
-11%
Decrease in property value within the past twelve months
Price Ranking
9th
Highest price per SQFT out of 33 condos in the Yonge and Bloor area
Sold Units
14
Units were Sold over the past twelve months
Rented Units
48
Units were Rented over the past twelve months
Best Value Rank
X Condos offers the best value out of 33 condos in the Yonge and Bloor neighbourhood
?
Appreciation Rank
X Condos has the highest ROI out of 33 condos in the Yonge and Bloor neighbourhood
?
Rental Yield
X Condos yields the highest rent prices out of 33 condos in the Yonge and Bloor neighbourhood
?
High Demand
X Condos is the most popular building out of 33 condos in the Yonge and Bloor neighbourhood
?
Transaction Insights at 110 Charles Street E
| Studio | 1 Bed | 1 Bed + Den | 2 Bed | 2 Bed + Den | 3 Bed | |
|---|---|---|---|---|---|---|
| Price Range | No Data | $572,500 - $657,000 | $720,000 - $780,800 | $835,000 - $995,000 | $1,200,000 - $1,534,000 | No Data |
| Avg. Cost Per Sqft | No Data | $1,123 | $1,088 | $1,089 | $1,098 | No Data |
| Price Range | No Data | $2,450 - $3,100 | $2,550 - $3,150 | $3,250 - $4,000 | $5,000 - $8,000 | No Data |
| Avg. Wait for Unit Availability | No Data | 51 Days | 51 Days | 36 Days | 137 Days | 280 Days |
| Avg. Wait for Unit Availability | No Data | 23 Days | 22 Days | 20 Days | 257 Days | No Data |
| Ratio of Units in Building | 2% | 27% | 30% | 36% | 7% | 1% |
Maintenance Fees
X Condos vs The Yonge and Bloor Area
