


417 - 1603 Eglinton Avenue W
Listing History
Unit Highlights
Maintenance Fees
Unit Details
- Air Conditioning
- Central Air
- Heat Source
- Gas
- Heating
- Forced Air
- Ensuite Laundry
- Yes
Room Dimensions
About this Listing
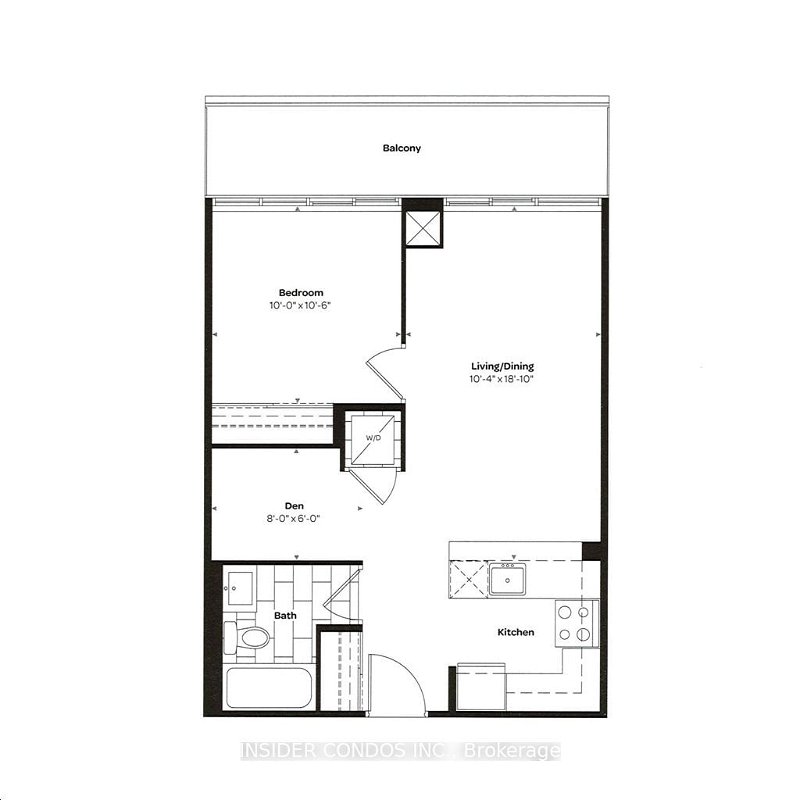
Discover urban living at its finest at Empire Midtown Condos, nestled at Eglinton & Dufferin. This sleek 1-bed + den, 587 sq.ft. condo offers a north-facing balcony. Enjoy a remarkable 91 Walk Score and 87 Transit Score, with Crosstown LRT and TTC subway just steps away. Plus, nearby parks, eateries, and shops ensure convenience and excitement. Building Amenities: 24 Hour Concierge , Electric Vehicle Charging Stations , Professionally Equipped Exercise Room, Guest Suites, Entertainment Lounge Equipped with Card Tables, Flat Screen TV, and Fireplace with Lounge Seating, Yoga & Pilates Studio, Bicycle Repair Room (with compressor), Party Room complete with Kitchen and Private Dining Room, Pet Wash Room, Outdoor Landscaped Terrace Complete with BBQ, Dining Areas and Relaxing Lounge Areas
ExtrasFridge, Stove, Microwave, Oven, Dishwasher, Washer & Dryer.
insider condos inc.MLS® #C8200000
Amenities
Nearby Amenities
Demographics
Based on the dissemination area as defined by Statistics Canada. A dissemination area contains, on average, approximately 200 – 400 households.
Price Trends
Building Trends At Empire Midtown
Days on Strata
List vs Selling Price
Offer Competition
Turnover of Units
Property Value
Price Ranking
Sold Units
Rented Units
Best Value Rank
Appreciation Rank
Rental Yield
High Demand
Transaction Insights at 1603 Eglinton Avenue W
| Studio | 1 Bed | 1 Bed + Den | 2 Bed | 2 Bed + Den | 3 Bed + Den | |
|---|---|---|---|---|---|---|
| Price Range | No Data | $505,000 - $527,500 | $508,000 - $659,000 | $667,000 | $760,000 - $800,000 | No Data |
| Avg. Cost Per Sqft | No Data | $906 | $935 | $940 | $910 | No Data |
| Price Range | No Data | $2,175 - $2,350 | $2,300 - $2,600 | $2,600 - $3,500 | $2,750 - $3,450 | No Data |
| Avg. Wait for Unit Availability | No Data | 163 Days | 107 Days | 109 Days | 147 Days | No Data |
| Avg. Wait for Unit Availability | 441 Days | 47 Days | 26 Days | 51 Days | 46 Days | No Data |
| Ratio of Units in Building | 1% | 19% | 41% | 17% | 24% | 1% |
