


Listing History
Unit Highlights
Maintenance Fees
Unit Details
- Air Conditioning
- Central Air
- Heat Source
- Gas
- Heating
- Forced Air
- Ensuite Laundry
- Yes
Room Dimensions
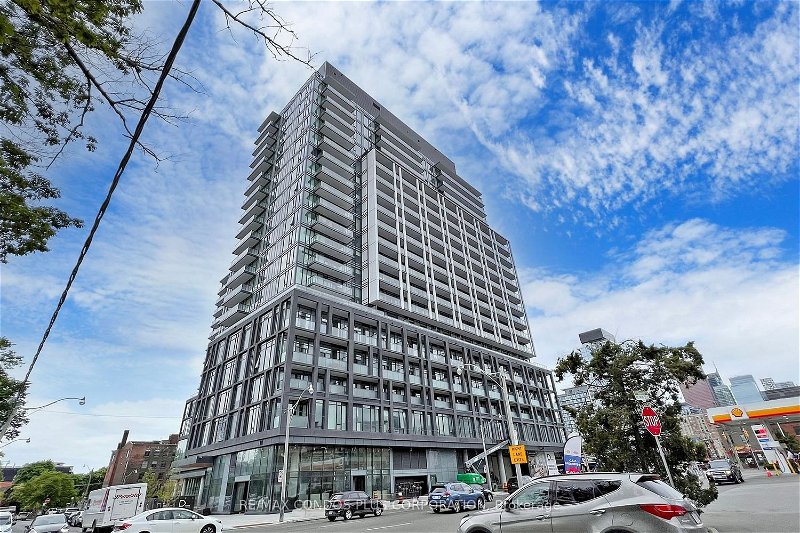
About this Listing
Enjoy a luxurious lifestyle in the 'Home on Power' by Great Gulf. 1 bedroom+ den (can be used 2nd bedroom) 549 SF + balcony 49 SF, Total 598 sq.ft., 9 ft Ceilings. It's bright and spacious with an open-concept layout. The unit features quality finishes, including a modern kitchen with stainless steel appliances, and floor-to-ceiling windows. It is located close to the downtown core and highways, steps away from TTC, shops, restaurants, and the Distillery District. The condo boasts great amenities such as an artist's workspace, gym/fitness/yoga studio, party room, meeting room/lounge, games room, outdoor pool, community garden, and BBQ area.
ExtrasS/S Appliances: Fridge, Stove, B/I Microwave/Hood, B/I Dishwasher. Stacked Washer & Dryer. Existing Electrical Light Fixtures And Window Coverings.
re/max condos plus corporationMLS® #C8097918
Amenities
Nearby Amenities
Demographics
Based on the dissemination area as defined by Statistics Canada. A dissemination area contains, on average, approximately 200 – 400 households.
Price Trends
Building Trends At Home Power + Adelaide Condos
Days on Strata
List vs Selling Price
Or in other words, the
Offer Competition
Turnover of Units
Property Value
Price Ranking
Sold Units
Rented Units
Best Value Rank
Appreciation Rank
Rental Yield
High Demand
Transaction Insights at 48 Power Street
| Studio | 1 Bed | 1 Bed + Den | 2 Bed | 2 Bed + Den | 3 Bed | 3 Bed + Den | |
|---|---|---|---|---|---|---|---|
| Price Range | No Data | $505,000 - $610,000 | $565,000 - $620,000 | $620,000 - $870,000 | $810,000 - $958,880 | $898,900 - $1,220,000 | No Data |
| Avg. Cost Per Sqft | No Data | $1,128 | $1,008 | $1,003 | $993 | $931 | No Data |
| Price Range | No Data | $2,050 - $2,450 | $2,100 - $2,700 | $2,500 - $3,800 | $2,900 - $5,300 | $3,600 - $4,500 | $3,250 - $4,600 |
| Avg. Wait for Unit Availability | No Data | 62 Days | 120 Days | 42 Days | 108 Days | 99 Days | No Data |
| Avg. Wait for Unit Availability | No Data | 12 Days | 8 Days | 6 Days | 17 Days | 40 Days | 70 Days |
| Ratio of Units in Building | 1% | 15% | 23% | 39% | 14% | 8% | 3% |
