
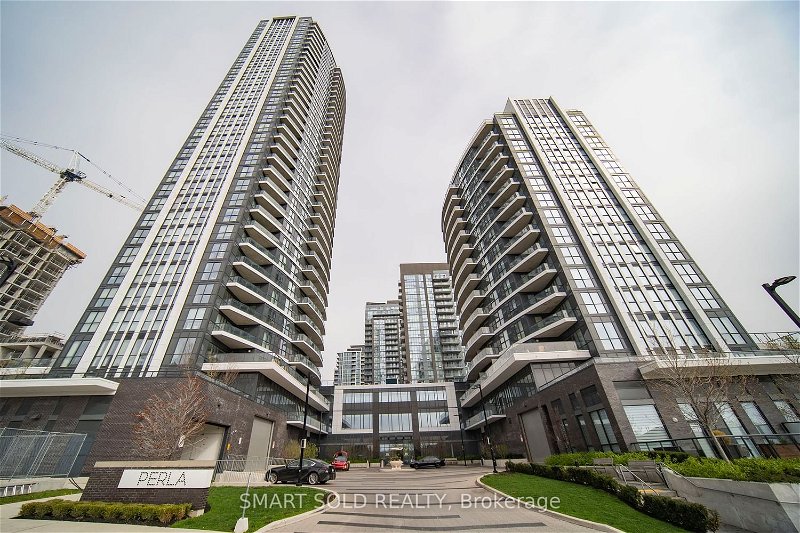


1109 - 35 Watergarden Drive
Listing History
Unit Highlights
Maintenance Fees
Unit Details
- Air Conditioning
- Central Air
- Heat Source
- Gas
- Heating
- Forced Air
- Ensuite Laundry
- Yes
Room Dimensions
About this Listing
Welcome To Perla Towers By Amazing Builder Pinnacle. This Stylish Spacious 2+1 Bedrooms Corner Unit Features Unobstructed Beautiful Views, Open Concept Layout & Upscale Finishes Throughout. Soring 9' High Ceilings, High-End Kitchen With Sleek Quartz Counters/Quality Stainless Steel Appliances, Extended Cabinets & Upgraded Backsplash. Wide Stylish Laminate Flooring T/O. Functional Den Space Ideal For Office/Study. Floor To Ceiling Windows Invites Ample Natural Light. Spacious And Bright Living Room W/O To A Private Open Balcony. Master Bedroom W/ Walk-In Closet & Full 4 Pc Bathroom. Minutes To Square One Shopping Centre, Cooksville Go Station, Highway 403, Future Lrt & Restaurants, Parks. Great Facilities Including Swimming Pool, Gym, Party, Billiards, Yoga Room, Hot Tub, Party Room, Games Room & More.
ExtrasS/S Stove, S/S Fridge, S/S Dishwasher, Microwave, Washer & Dryer, Elf, Window Covering.
smart sold realtyMLS® #W8293482
Amenities
Nearby Amenities
Demographics
Based on the dissemination area as defined by Statistics Canada. A dissemination area contains, on average, approximately 200 – 400 households.
Price Trends
Building Trends At Perla Towers
Days on Strata
List vs Selling Price
Offer Competition
Turnover of Units
Property Value
Price Ranking
Sold Units
Rented Units
Best Value Rank
Appreciation Rank
Rental Yield
High Demand
Transaction Insights at 35 Watergarden Drive
| 1 Bed | 1 Bed + Den | 2 Bed | 2 Bed + Den | 3 Bed | 3 Bed + Den | |
|---|---|---|---|---|---|---|
| Price Range | $518,500 - $588,000 | $580,000 - $612,500 | No Data | $770,000 - $840,000 | No Data | No Data |
| Avg. Cost Per Sqft | $901 | $821 | No Data | $742 | No Data | No Data |
| Price Range | $2,295 - $2,700 | $2,375 - $2,650 | $3,250 | $3,000 - $3,500 | $3,750 | No Data |
| Avg. Wait for Unit Availability | 34 Days | 80 Days | No Data | 31 Days | 370 Days | No Data |
| Avg. Wait for Unit Availability | 16 Days | 29 Days | 175 Days | 10 Days | 574 Days | No Data |
| Ratio of Units in Building | 33% | 17% | 4% | 47% | 2% | 2% |
