


1 / 6
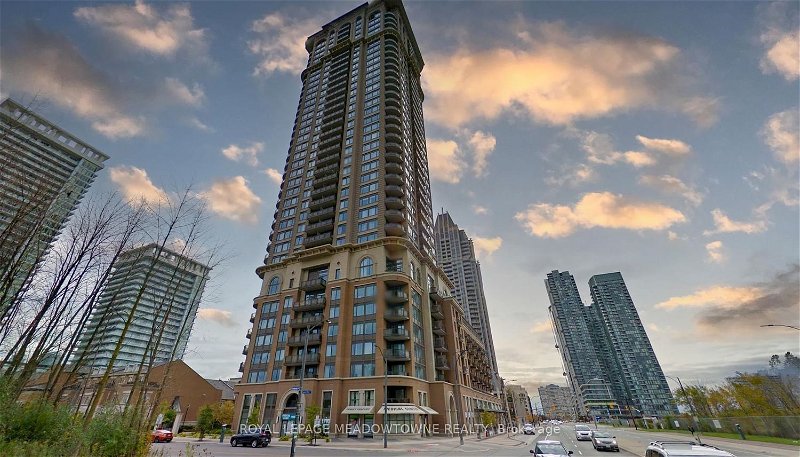
910 - 385 Prince of Wales Drive
For RentChicago CondosEst Lease Timeframe 9 Days
$2,450/mth
1 Bed + 1
1 Bath
1 Parking
800 - 899 SQFT
53 Days on Strata
Listing History
Unit Highlights
Property Type:
Condo
Utilities Included:
No
Outdoor Space:
Balcony
Furnished:
No
Exposure:
South West
Locker:
Owned
Possession Date:
September 1, 2024
Lease Term:
1 Year
Renter's Market
Balanced
Landlord's Market
Utilities Included
Rent Includes
Parking
Excluded
Hydro
Heat
Air Conditioning
Water
Unit Details
- Air Conditioning
- Central Air
- Heat Source
- Gas
- Heating
- Forced Air
- Ensuite Laundry
- No
Room Dimensions
Living
Hardwood Floor, Walkout To Balcony, Combined with Dining
17.03 x 12.4ft
Dining
Hardwood Floor, Open Concept, Combined with Living
17.03 x 12.4ft
Kitchen
Ceramic Floor, Built-in Appliances, Breakfast Area
10.01 x 8.53ft
About this Listing
Live Near The Heart Of Mississauga, Within Walking Distance To Square One And Near Conveniences PlusEasy Access To Public Transit And Hwy 403,401,Qew! Unit Features Hardwood Floors Throughout, SpaciousLiving/Dining Area, Den And Bedroom With Unobstructed S/Sw Views Of Mississauga Complete With PlentyOf Amenities And 24/7 Concierge Security!
ExtrasIncludes: Fridge, Stove, Exhaust Hood, Dishwasher, Stacked Clothing Washer And Dryer, All ElectricalLighting Fixtures And Window Coverings.
royal lepage meadowtowne realtyMLS® #W8133736
Amenities
Visitor Parking
Indoor Pool
Media Room
Party Room
Rec Room
Indoor Parking
Nearby Amenities
9/10
Walkability
One small step for you. One giant leap towards never needing a gym membership.
8/10
Transit
So frequent, you might accidentally start collecting tickets.
5/10
Bikeability
A perfect balance of challenge and 'Hey, I didn’t know there was a bike shop here!'
Demographics
Based on the dissemination area as defined by Statistics Canada. A dissemination area contains, on average, approximately 200 – 400 households.
Population
9,194
Average Individual Income
$63,586
Average Household Size
2 persons
Average Age
60
Average Household Income
$105,144
Dominant Housing Type
Detached
Population By Age
Household Income
Housing Types & Tenancy
Detached
41%
High Rise Apartment
24%
Semi Detached
24%
Low Rise Apartment
6%
Duplex
3%
Marital Status
Commute
Languages (Primary Language)
English
83%
Other
8%
Punjabi
4%
Tagalog
1%
Hindi
1%
Spanish
1%
Mandarin
1%
Urdu
1%
Education
High School
32%
University and Above
25%
College
21%
None
15%
Apprenticeship
3%
University Below Batchelor
1%
Major Field of Study
Business Management
26%
Architecture & Engineering
20%
Social Sciences
12%
Health & Related Fields
10%
Math & Computer Sciences
6%
Personal, Protective & Transportation Services
5%
Humanities
4%
Education
4%
Physical Sciences
3%
Visual & Performing Arts
3%
Agriculture & Natural Resources
1%
Price Trends
Building Trends At Chicago Condos
Days on Strata
Units at Chicago Condos spend an average of
30
Days on Strata
based on recent sales
List vs Selling Price
On average, these condos sell for
3%
below
the list price.
Offer Competition
Condos in this building have a
LOWchance of receiving
Multiple Offers
Turnover of Units
On average, each unit is owned for
5.4
YEARS before being sold againProperty Value
4%
Increase in property value within the past twelve months
Price Ranking
8th
Highest price per SQFT out of 43 condos in the Downtown Core area
Sold Units
19
Units were Sold over the past twelve months
Rented Units
70
Units were Rented over the past twelve months
Best Value Rank
Chicago Condos offers the best value out of 43 condos in the Downtown Core neighbourhood
?
Appreciation Rank
Chicago Condos has the highest ROI out of 43 condos in the Downtown Core neighbourhood
?
Rental Yield
Chicago Condos yields the highest rent prices out of 43 condos in the Downtown Core neighbourhood
?
High Demand
Chicago Condos is the most popular building out of 43 condos in the Downtown Core neighbourhood
?
Transaction Insights at 385 Prince of Wales Drive
| Studio | 1 Bed | 1 Bed + Den | 2 Bed | 2 Bed + Den | 3 Bed | 3 Bed + Den | |
|---|---|---|---|---|---|---|---|
| Price Range | $425,000 - $449,000 | $520,000 - $555,000 | $540,000 - $615,000 | $710,000 - $719,000 | No Data | No Data | No Data |
| Avg. Cost Per Sqft | $1,035 | $908 | $835 | $830 | No Data | No Data | No Data |
| Price Range | $1,900 - $2,150 | $2,350 - $2,600 | $2,300 - $2,950 | $2,800 - $3,100 | $2,800 - $2,900 | $3,800 | $3,600 - $3,950 |
| Avg. Wait for Unit Availability | 143 Days | 25 Days | 23 Days | 71 Days | 98 Days | 1449 Days | 327 Days |
| Avg. Wait for Unit Availability | 54 Days | 12 Days | 11 Days | 46 Days | 106 Days | 369 Days | 111 Days |
| Ratio of Units in Building | 6% | 33% | 39% | 10% | 7% | 2% | 6% |
Maintenance Fees
Chicago Condos vs The Downtown Core Area
